
Page 146 - Profile's Stock Exchange Handbook - 2025 Issue 1
P. 146
JSE – MAS Profile’s Stock Exchange Handbook: 2025 – Issue 1
Master Drilling Group Ltd. MC Mining Ltd.
MAS MCM
ISIN: ZAE000171948 SHORT: MASTDRILL CODE: MDI ISIN: AU000000MCM9 SHORT: MC MINING CODE: MCZ
REG NO: 2011/008265/06 FOUNDED: 1986 LISTED: 2012 REG NO: ABN008905388 FOUNDED: 1979 LISTED: 2006
NATURE OF BUSINESS: Master Drilling was established in 1986 and NATURE OF BUSINESS: MC Mining is an AIM/ASX/JSE-listed coal
listed on the Johannesburg Stock Exchange Ltd. in 2012. The Group exploration, development and mining company operating in South Africa.
delivers innovative drilling technologies and mining solutions and MCMining’skey projectsincludetheUitkomstColliery(metallurgicaland
services. Master Drilling has built trusted partner relationships with thermal coal), Makhado Project (hard coking coal), Vele Colliery
blue-chip and mid-tier clients in the mining, hydro-electric energy, civil, (semi-soft coking and thermal coal), and the Greater Soutpansberg
engineering, as well as construction sectors worldwide. The Company is Projects (coking and thermal coal).
exposed to various key commodities that ensure its sustainability. The SECTOR: Energy—Energy—OilGas&Coal—Coal
Master Drilling business model of providing drilling solutions and mining NUMBER OF EMPLOYEES: 554
services to clients through tailor-made designs, coupled with a flexible DIRECTORS: Chee Sin A (ne, Sing), Muhui H, Pavlovski B (ne),
support and logistics chain, makes it the preferred partner throughout the Senosi M (ne), West Dr S (ne), ZhenBH(ne, China),
life cycle of projects. He Y ( (CEO & MD, ne)
SECTOR:BasicMaterials—BasicResrcs—IndMet&Min—GeneralMining MAJOR ORDINARY SHAREHOLDERS as at 03 Sep 2024
NUMBER OF EMPLOYEES: 3 007 Goldway Capital Investment Ltd. 26.30%
DIRECTORS: Jordaan B J (Executive), Brink A W (ld ind ne), Senosi Group Investment Holdings (Pty) Ltd. 20.00%
Deshmukh AA(ind ne), Faul H J (ind ne), Matloa O (ind ne), Kinetic Crest Ltd. 13.00%
Ramathe M (ind ne), Sheppard G R (alt), van der Merwe H (Chair, ind ne), POSTAL ADDRESS: Ground Floor, Greystone Building, Fourways Golf
Pretorius D C (CEO), Dixon E (COO, alt), van Deventer A J (CFO) Park, Roos Street, Fourways, 2191
MAJOR ORDINARY SHAREHOLDERS as at 31 Dec 2023 MORE INFO: www.sharedata.co.za/sdo/jse/MCZ
Barrange (Pty) Ltd. 28.80% COMPANY SECRETARY: Blagojce (Bill) Pavlovski
MDG Equity Holdings (Pty) Ltd. 25.70% TRANSFER SECRETARY: Computershare Investor Services (Pty) Ltd.
Ninety One Ltd. 5.90%
POSTAL ADDRESS: PO Box 902, Fochville, 2515 SPONSOR: Investec Bank Ltd.
AUDITORS: Mazars Inc.
MORE INFO: www.sharedata.co.za/sdo/jse/MDI
COMPANY SECRETARY: Andrew Colin Beaven CAPITAL STRUCTURE AUTHORISED ISSUED
TRANSFER SECRETARY: Computershare Investor Services (Pty) Ltd. MCZ Ords no par value - 414 013 349
SPONSOR: Investec Bank Ltd. LIQUIDITY: Jan25 Avg 241 777 shares p.w., R436 421.6(3.0% p.a.)
AUDITORS: BDO SA
OILP 40 Week MA MC MINING
CAPITAL STRUCTURE AUTHORISED ISSUED
5385
MDI Ords no par value 500 000 000 150 536 779
DISTRIBUTIONS [ZARc] 4328
Ords no par value Ldt Pay Amt
Final No 6 14 May 24 20 May 24 52.50 3271
Final No 5 16 May 23 22 May 23 47.50
2214
LIQUIDITY: Jan25 Avg 273 240 shares p.w., R3.4m(9.4% p.a.)
1157
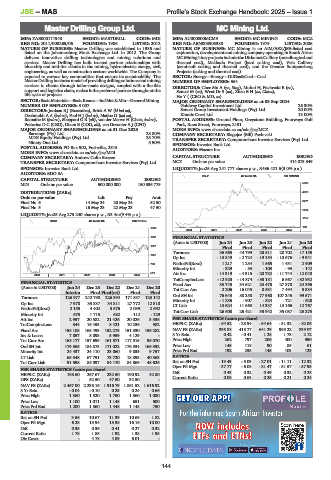
INDM 40 Week MA MASTDRILL
1862 100
2020 | 2021 | 2022 | 2023 | 2024 |
1591 FINANCIAL STATISTICS
(Amts in USD’000) Jun 24 Jun 23 Jun 22 Jun 21 Jun 20
1321 Final Final Final Final Final
Turnover 36 665 44 799 23 511 20 702 17 155
1051
Op Inc - 13 849 - 2 724 - 19 154 - 10 676 - 9 941
NetIntPd(Rcvd) 1 217 1 284 1 565 1 431 2 909
780
Minority Int - 329 - 83 - 103 - 93 - 142
510 Att Inc - 14 319 - 4 315 - 20 732 - 11 744 - 12 048
2020 | 2021 | 2022 | 2023 | 2024 |
TotCompIncLoss - 12 923 - 14 874 - 33 181 6 567 - 32 932
FINANCIAL STATISTICS
Fixed Ass 33 745 34 621 23 475 27 370 24 396
(Amts in USD’000) Jun 24 Dec 23 Dec 22 Dec 21 Dec 20 Tot Curr Ass 2 206 16 045 8 531 7 494 5 534
Interim Final Final(rst) Final Final
Turnover 126 977 242 798 226 394 171 837 123 142 Ord SH Int 76 643 88 258 77 960 107 245 99 571
- 907
- 824
- 721
- 628
Op Inc 7 978 33 837 34 811 27 772 12 310 Minority Int - 1 236 11 663 14 337 13 166 12 767
13 624
LT Liab
NetIntPd(Rcvd) 2 155 4 402 3 576 2 039 2 692
Minority Int 675 1 715 682 - 112 - 129 Tot Curr Liab 26 608 25 421 33 942 35 087 23 273
Att Inc 2 957 20 582 21 426 20 026 3 336 PER SHARE STATISTICS (cents per share)
TotCompIncLoss 344 16 453 8 421 10 236 982 HEPS-C (ZARc) - 64.52 - 25.94 - 54.64 - 51.32 - 82.06
Fixed Ass 158 108 165 493 152 275 151 330 156 282 NAV PS (ZARc) 336.88 415.77 641.29 995.22 839.07
Inv & Loans 7 857 8 093 5 959 4 129 - 3 Yr Beta 0.42 - 0.41 1.28 1.73 2.12
Tot Curr Ass 163 177 157 699 161 571 117 315 96 070 Price High 262 797 206 400 950
Ord SH Int 179 565 184 873 171 022 176 534 166 392 Price Low 145 118 90 85 61
Minority Int 24 437 24 110 23 060 9 835 9 757 Price Prd End 192 235 145 103 129
LT Liab 65 548 67 791 73 720 18 893 40 363 RATIOS
Tot Curr Liab 91 598 85 097 84 170 84 869 48 626 Ret on SH Fnd - 19.43 - 5.03 - 27.01 - 11.11 - 12.32
Oper Pft Mgn - 37.77 - 6.08 - 81.47 - 51.57 - 57.95
PER SHARE STATISTICS (cents per share) D:E 0.43 0.32 0.49 0.32 0.28
HEPS-C (ZARc) 168.60 267.67 232.50 190.92 42.80 Current Ratio 0.08 0.63 0.25 0.21 0.24
DPS (ZARc) - 52.50 47.50 32.50 -
NAV PS (ZARc) 2 457.00 2 235.16 1 916.79 1 861.52 1 616.92
3 Yr Beta - 0.04 - 0.10 0.25 0.24 0.66
Price High 1 360 1 520 1 750 1 360 1 080
Price Low 1 100 1 011 1 148 651 500
Price Prd End 1 200 1 360 1 448 1 148 750
RATIOS
Ret on SH Fnd 3.56 10.67 11.39 10.69 1.82
Oper Pft Mgn 6.28 13.94 15.38 16.16 10.00
D:E 0.35 0.36 0.41 0.27 0.32
Current Ratio 1.78 1.85 1.92 1.38 1.98
Div Cover - 4.78 4.89 6.01 -
144