
Page 187 - Profile's Stock Exchange Handbook -2024 Issue 4
P. 187
Group Annual Results for the 6 months
ended 30 June 2024
Earnings
Net result from financial services Total net fund inflows Return on Group Equity Value per share
14% (19% per share) R24,0 billion (R11,1 billion in 2023) 9,3%
Net operational earnings Net value of new convered business Adjusted Return on Group Equity Value per share
8% (12% per share) 10% to R1.4 billion 10,7%
Cash net result from financial services Net new convered business margin Capital management
15% (20% per share) 2,73% (2,83% in 2023)
Discretionary capital at 30 June 2024
New business Group Equity Value R3.8 billion
Life insurance new business volumes (PVNBP) Group Equity Value per share Sanlam Group solvency cover ratio
14% to R51,0 billion R73,41 166% (December 2023: 170%)
SALIENT RESULTS SHAREHOLDERS’ FUND INCOME STATEMENT
for the 6 months ended 30 June 2024 2024 2023 % Reviewed Reviewed
30 June 30 June
SANLAM GROUP R’million 2024 2023
Earnings RESULT FROM FINANCIAL SERVICES BEFORE TAX 11 025 9 647
Net result from financial services R million 7 056 6 177 14% Tax on result from financial services (2 819) (2 768)
Cash net result from financial services R million 7 181 6 256 15% Non-controlling interest (1 150) (702)
Net operational earnings R million 8 087 7 486 8% Net result from financial services 7 056 6 177
Headline earnings R million 9 838 6 902 43%
Weighted average number of shares million 2 108 2 068 2% Net investment income` 623 657
Adjusted weighted number of shares million 2 116 2 204 (4%) Net investment surpluses 589 881
Net result from fin. services per share cents 333 280 19% Project expenses (181) (229)
Cash net result from fi.services per share cents 339 284 20%
Net operational earnings per share cents 382 340 12% Net operational earnings 8 087 7 486
Headline earnings per share cents 473 339 40% Shareholder fund adjustments 1 898 158
Diluted headline earnings per share cents 467 334 40% Net amortisation of value of business acquired
IFRS information and other intangibles (106) (57)
Basic profit attributable to shareholders Impairments (513) 687
per share cents 478 389 23% Net equity-accounted earnings (243) 18
Diluted profit attributable to shareholders
per share cents 471 383 23% Net profit on disposal of subsidiaries 790 1 275
and associated companies
Business volumes
Total new business volumes 203 992 190 793 7% Normalised attributable earnings 9 913 9 567
Value of new covered business 1 394 1 265 10% Fund transfers 19 (1 651)
Life insurance business volumes (PVNBP) 51 044 44 751 14%
New covered business margin 2,73% 2,83% Attributable earnings per Group statement
Total net client cash flows 23 972 11 357 >100% of comprehensive income 9 932 7 916
Group Equity Value
Group equity value* R million 155 270 149 904
Group equity value per share* cents 7 341 7 086
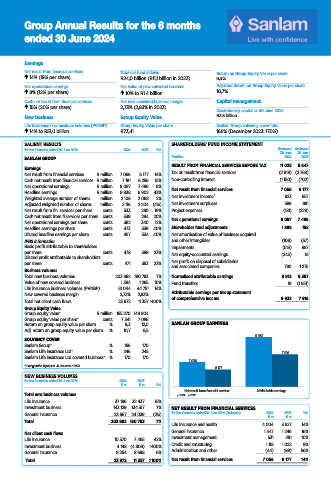
Return on group equity value per share % 9,3 12,0 SANLAM GROUP EARNINGS
Adj. return on group equity value per share % 10,7 8,5
9 932
SOLVENCY COVER
Sanlam Group* % 166 170
Sanlam Life Insurance Ltd* % 246 245 7 916
Sanlam Life Insurance Ltd covered business* % 170 170
7 056
* Comparative figures on 31 December 2023.
6 177
NEW BUSINESS VOLUMES
for the 6 months ended 30 June 2024 2024 2023
R’m R’m %
Net result from financial services Attributable earnings
Total new business volumes 2024 2023
Life insurance 37 196 32 437 15%
Investment business 143 129 134 317 7% NET RESULT FROM FINANCIAL SERVICES
General insurance 23 667 24 039 (2%) for the 6 months ended 30 June 2024 (reviewed) 2024 2023 %
R’m R’m
Total 203 992 190 793 7%
Life insurance and health 4 004 3 527 14%
Net client cash fl ows General insurance 1 447 1 246 16%
Life insurance 10 570 7 465 42% Investment management 531 481 10%
Investment business 4 148 (4 806) >100% Credit and structuring 1 118 1 022 9%
General insurance 9 254 8 698 6% Administration and other (44) (99) 56%
Total 23 972 11 357 >100% Net result from financial services 7 056 6 177 14%
30/10/2024 22:37:27
JSE R&E book IR2024 v20241030.indd 1
JSE R&E book IR2024 v20241030.indd 1 30/10/2024 22:37:27