
Page 152 - Profile's Stock Exchange Handbook -2024 Issue 4
P. 152
JSE – MUL Profile’s Stock Exchange Handbook: 2024 – Issue 4
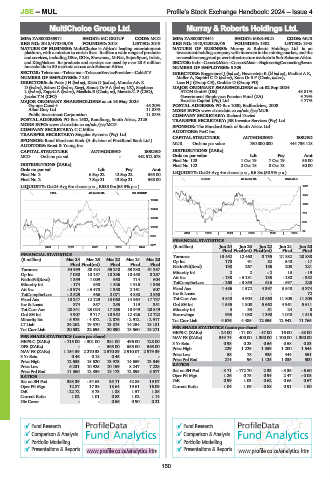
MultiChoice Group Ltd. Murray & Roberts Holdings Ltd.
MUL MUR
ISIN: ZAE000265971 SHORT: MC GROUP CODE: MCG ISIN: ZAE000073441 SHORT: M&R-HLD CODE: MUR
REG NO: 2018/473845/06 FOUNDED: 2018 LISTED: 2019 REG NO: 1948/029826/06 FOUNDED: 1902 LISTED: 1948
NATURE OF BUSINESS: MultiChoice is Africa’s leading entertainment NATURE OF BUSINESS: Murray & Roberts Holdings Ltd. is an
platform, with a mission to enrich lives. It offers a wide range of products investment holding company with interests in the mining market, and the
and services, including DStv, GOtv, Showmax, M-Net, SuperSport, Irdeto, renewableenergyandpowerinfrastructuremarketsinSub-SaharanAfrica.
and KingMakers. Its products and services are used by over 23.5 million SECTOR: Inds—Constr&Mats—Constr&Mats—EngineeringContractingServcs
households in 50 markets across sub-Saharan Africa. NUMBER OF EMPLOYEES: 5 309
SECTOR: Telecoms—Telecoms—TelecomServiceProvider—CableTV DIRECTORS: Boggenpoel J (ind ne), Havenstein R (ld ind ne), Maditsi A K,
NUMBER OF EMPLOYEES: 7 251 Muller A, Raphiri C D (ind ne), Kana Dr S P (Chair, ind ne),
DIRECTORS: du PreezJH(ind ne), Klein D (ind ne), Moroka Adv K Laas H J (Group CE), Grobler D (Group FD)
D(ind ne), Sabwa C (ind ne, Keny), Sanusi Dr F A (ind ne, UK), Stephens MAJOR ORDINARY SHAREHOLDERS as at 02 Sep 2024
L(ind ne), Zappia A (ind ne), Masilela E (Chair, ne), Mawela C P (CEO), ATON GmbH (DE) 43.81%
Jacobs T N (CFO) Government Employees Pension Fund (ZA) 9.79%
MAJOR ORDINARY SHAREHOLDERS as at 16 May 2024 Excelsia Capital (Pty) Ltd. 4.77%
Groupe Canal+ 45.20% POSTAL ADDRESS: PO Box 1000, Bedfordview, 2008
Allan Gray Ltd. 11.83% MORE INFO: www.sharedata.co.za/sdo/jse/MUR
Public Investment Corporation 11.83% COMPANY SECRETARY: Richard Davies
POSTAL ADDRESS: PO Box 1502, Randburg, South Africa, 2125 TRANSFER SECRETARY: JSE Investor Services (Pty) Ltd.
MORE INFO: www.sharedata.co.za/sdo/jse/MCG SPONSOR: The Standard Bank of South Africa Ltd.
COMPANY SECRETARY: C C Miller AUDITORS: PwC Inc.
TRANSFER SECRETARY: Singular Systems (Pty) Ltd.
SPONSOR: Rand Merchant Bank (A division of FirstRand Bank Ltd.) CAPITAL STRUCTURE AUTHORISED ISSUED
AUDITORS: Ernst & Young Inc. MUR Ords no par value 750 000 000 444 736 118
DISTRIBUTIONS [ZARc]
CAPITAL STRUCTURE AUTHORISED ISSUED
MCG Ords no par val - 442 512 678 Ords no par value Ldt Pay Amt
Final No 123 1 Oct 19 7 Oct 19 55.00
DISTRIBUTIONS [ZARc] Final No 122 2 Oct 18 8 Oct 18 50.00
Ords no par val Ldt Pay Amt
Final No 3 6 Sep 22 12 Sep 22 565.00 LIQUIDITY: Oct24 Avg 4m shares p.w., R6.8m(50.9% p.a.)
Final No 2 7 Sep 21 13 Sep 21 565.00 CONM 40 Week MA M&R-HLD
LIQUIDITY: Oct24 Avg 6m shares p.w., R558.0m(65.3% p.a.) 1681
FTEL 40 Week MA MC GROUP
1357
19049
1034
16494
710
13938
386
11382
62
2019 | 2020 | 2021 | 2022 | 2023 | 2024
8827
FINANCIAL STATISTICS
6271 (R million) Jun 24 Jun 23 Jun 22 Jun 21 Jun 20
2020 | 2021 | 2022 | 2023 | 2024
Final Final(rst) Final(rst) Final Final
FINANCIAL STATISTICS Turnover 13 452 12 460 8 755 21 882 20 838
(R million) Mar 24 Mar 23 Mar 22 Mar 21 Mar 20 Op Inc 170 91 82 540 - 17
Final Final(rst) Final Final Final
Turnover 54 999 58 424 55 240 53 338 51 387 NetIntPd(Rcvd) 130 267 186 208 221
Op Inc 7 080 10 157 10 296 10 458 8 267 Minority Int 2 2 - 2 13 - 19
NetIntPd(Rcvd) 1 359 1 009 950 714 604 Att Inc - 138 - 3 181 135 - 180 - 352
Minority Int - 174 558 1 526 1 916 1 363 TotCompIncLoss - 263 - 3 853 616 - 597 225
Att Inc - 3 974 - 3 478 1 358 2 161 507 Fixed Ass 1 486 1 572 4 397 3 548 3 374
TotCompIncLoss - 2 529 966 2 071 4 380 2 950 Inv & Loans - - - - 72
Fixed Ass 10 247 12 129 13 060 14 964 17 737 Tot Curr Ass 4 840 4 904 10 860 11 805 11 805
Inv & Loans 374 357 255 119 351 Ord SH Int 1 555 1 808 5 662 4 961 5 611
Tot Curr Ass 20 841 23 024 17 265 18 949 20 849 Minority Int 3 33 51 24 8
Ord SH Int 4 907 9 717 10 952 12 426 12 722 Borrowings 933 1 080 1 390 1 040 1 515
Minority Int - 5 975 - 4 372 - 2 876 - 2 912 - 2 917 Tot Curr Liab 4 676 4 485 12 355 12 942 11 765
LT Liab 24 262 19 570 13 875 14 254 18 181 PER SHARE STATISTICS (cents per share)
Tot Curr Liab 20 532 22 695 20 890 18 560 18 271
HEPS-C (ZARc) - 24.00 - 71.00 - 47.00 16.00 - 88.00
PER SHARE STATISTICS (cents per share) NAV PS (ZARc) 349.74 400.00 1 300.00 1 100.00 1 300.00
HEPS-C (ZARc) - 715.00 - 301.00 381.00 496.00 128.00 3 Yr Beta 0.98 0.23 0.56 0.58 0.83
DPS (ZARc) - - 565.00 565.00 565.00 Price High 229 1 229 1 559 1 200 1 544
NAV PS (ZARc) 1 154.59 2 270.33 2 570.89 2 910.07 2 979.39 Price Low 58 78 925 444 351
3 Yr Beta 0.46 0.18 0.45 - -
Price High 12 653 15 520 13 973 14 559 13 849 Price Prd End 214 96 1 125 1 035 500
Price Low 6 231 10 925 10 159 8 247 7 228 RATIOS
Price Prd End 11 360 12 336 13 173 12 895 8 577 Ret on SH Fnd - 8.71 - 172.70 2.33 - 3.35 - 6.60
RATIOS Oper Pft Mgn 1.26 0.73 0.94 2.47 - 0.08
Ret on SH Fnd 388.39 - 54.63 35.71 42.85 19.07 D:E 0.99 1.03 0.62 0.65 0.67
Oper Pft Mgn 12.87 17.38 18.64 19.61 16.09 Current Ratio 1.04 1.09 0.88 0.91 1.00
D:E - 22.72 3.73 1.88 1.57 1.85
Current Ratio 1.02 1.01 0.83 1.02 1.14
Div Cover - - 0.56 0.90 0.21
Fund Research Fund Research
Comparison & Analysis Comparison & Analysis
Portfolio Modelling Portfolio Modelling
Presentations & Reports www.profile.co.za/analytics.htm Presentations & Reports www.profile.co.za/analytics.htm
150