
Page 147 - Profile's Stock Exchange Handbook -2024 Issue 4
P. 147
Profile’s Stock Exchange Handbook: 2024 – Issue 4 JSE – MET
Metrofile Holdings Ltd. Momentum Group Ltd.
MET MOM
ISIN: ZAE000061727 SHORT: METROFILE CODE: MFL ISIN: ZAE000269890 SHORT: MOMENTUM CODE: MTM
REG NO: 1983/012697/06 FOUNDED: 1983 LISTED: 1995 REG NO: 2000/031756/06 FOUNDED: 2000 LISTED: 2001
NATURE OF BUSINESS: Over the past four decades, Metrofile has NATURE OF BUSINESS: Momentum Group Ltd. (Momentum) is a South
established a credible and trusted reputation of being leaders in African-basedfinancialservices group. The Group’sclient-facing retailand
information governance and management offering quality products and specialist brands enable businesses and people from all walks of life to
services to organisations of all sizes and sectors across South Africa, Kenya, achieve their financial goals and life aspirations.
Botswana, Mozambique and the Middle East. We operate from 70 facilities SECTOR: Fins—Insurance—Life Insurance—Life Insurance
at 35 locations covering 117 525 square meters of warehousing space. NUMBER OF EMPLOYEES: 15 991
SECTOR:Inds—IndsGoods&Services—IndsSupptServ—ProfBusSupportServ DIRECTORS: Cilliers (Marais) J (Deputy CE), de Beer L (ind ne),
NUMBER OF EMPLOYEES: 1 234 Dunkley N J (ind ne), Gobalsamy T (ind ne), Jurisich Prof S (ind ne),
DIRECTORS: Khumalo A (ne), Mthimunye L E (ind ne), RoodL(alt), Leautier Dr F (ind ne, Tzn), Matlakala P (ind ne), Mbethe D M, Meyer
Seabrooke C S (ne), Storom L (ne), Zilwa S V (ld ind ne), Langeni P (Chair, ld HP(ne), Park D J (ind ne), Rapeti S (ind ne), Soondarjee T D (ind ne), Baloyi P
ind ne), Bomela M S (Dep Chair, ne), SeopaTS(CEO),MansinghS(CFO) C(Chair, ind ne), Cooper P (Acting Chair, ind ne), Ketola R (Group CFO)
MAJOR ORDINARY SHAREHOLDERS as at 30 Jun 2024 MAJOR ORDINARY SHAREHOLDERS as at 03 Oct 2024
Mineworkers Investment Company (Pty) Ltd. 38.16% Public Investment Corporation SOC Ltd. 15.70%
Ninety One (Cape Town) 9.42% Government Employees Pension Fund 15.15%
Afropulse 8.40% Allan Gray (Pty) Ltd. 10.02%
POSTAL ADDRESS: PO Box 40264, Cleveland, 2022 POSTAL ADDRESS: PO Box 7400, Centurion, 0046
MORE INFO: www.sharedata.co.za/sdo/jse/MFL MORE INFO: www.sharedata.co.za/sdo/jse/MTM
COMPANY SECRETARY: Elizabeth Maria Smuts COMPANY SECRETARY: Gcobisa Tyusha
TRANSFER SECRETARY: Computershare Investor Services (Pty) Ltd. TRANSFER SECRETARY: JSE Investor Services (Pty) Ltd.
SPONSOR: Standard Bank of SA Ltd. SPONSOR: Merrill Lynch SA (Pty) Ltd.
AUDITORS: BDO South Africa Inc. AUDITORS: Ernst & Young Inc.
CAPITAL STRUCTURE AUTHORISED ISSUED CAPITAL STRUCTURE AUTHORISED ISSUED
MFL Ords 0.6146c ea 500 000 000 433 699 958 MTM Ords 0.0001c ea 2 000 000 000 1 405 148 402
DISTRIBUTIONS [ZARc] DISTRIBUTIONS [ZARc]
Ords 0.6146c ea Ldt Pay Amt Ords 0.0001c ea Ldt Pay Amt
Final No 30 1 Oct 24 7 Oct 24 7.00 Final No 43 15 Oct 24 21 Oct 24 65.00
Interim No 29 2 Apr 24 8 Apr 24 7.00 Interim No 42 16 Apr 24 22 Apr 24 60.00
LIQUIDITY: Oct24 Avg 1m shares p.w., R3.6m(15.4% p.a.) LIQUIDITY: Oct24 Avg 18m shares p.w., R430.7m(67.0% p.a.)
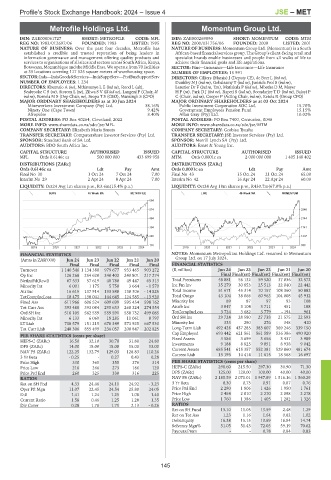
SUPS 40 Week MA METROFILE LIFE 40 Week MA MOMENTUM
684
574 2548
464 2144
354 1741
245 1337
135 933
2019 | 2020 | 2021 | 2022 | 2023 | 2024 2019 | 2020 | 2021 | 2022 | 2023 | 2024
FINANCIAL STATISTICS NOTES: Momentum Metropolitan Holdings Ltd. renamed to Momentum
(Amts in ZAR’000) Jun 24 Jun 23 Jun 22 Jun 21 Jun 20 Group Ltd. on 17 July 2024.
Final Final Final Final Final FINANCIAL STATISTICS
Turnover 1 140 546 1 134 380 979 677 933 465 903 272 (R million) Jun 24 Jun 23 Jun 22 Jun 21 Jun 20
Op Inc 126 268 254 620 240 402 240 801 217 274 Final Final(rst) Final(rst) Final(rst) Final(rst)
NetIntPd(Rcvd) 67 533 57 619 48 780 49 447 65 313 Total Premiums 58 881 56 132 59 520 37 036 32 572
Minority Int 6 001 1 175 5 750 3 664 - 1 570 Inc Fm Inv 35 279 30 853 25 513 22 040 22 442
Att Inc 16 615 137 914 133 588 138 306 - 14 825 Total Income 51 671 45 314 70 157 108 360 50 882
TotCompIncLoss 18 475 138 041 144 645 124 585 - 13 920 Total Outgo 43 104 38 066 60 963 104 008 45 912
Fixed Ass 611 966 606 524 609 699 595 454 598 162 Minority Int 89 87 97 93 108
Tot Curr Ass 393 488 393 084 295 633 268 324 274 554 Attrib Inc 3 847 3 104 3 711 451 188
Ord SH Int 516 105 562 559 559 591 558 732 499 085 TotCompIncLoss 3 724 3 682 3 779 - 194 961
Minority Int 6 133 6 069 18 285 11 061 8 797 Ord SH Int 29 724 28 580 27 738 21 575 22 593
LT Liab 738 579 151 215 678 349 573 925 667 530 Minority Int 333 290 276 348 410
Tot Curr Liab 248 306 855 499 236 057 208 847 202 825 Long-Term Liab 492 428 437 285 383 607 369 246 339 150
Cap Employed 693 442 621 561 561 589 536 386 490 920
PER SHARE STATISTICS (cents per share) Fixed Assets 3 586 3 699 3 656 3 437 3 989
HEPS-C (ZARc) 16.50 32.10 30.70 31.80 24.80
DPS (ZARc) 14.00 18.00 18.00 15.00 13.00 Investments 9 188 8 825 9 051 8 938 9 042
NAV PS (ZARc) 122.25 132.79 129.03 128.83 110.26 Current Assets 685 541 615 357 552 381 529 860 481 674
16 697
14 414
13 193
Current Liab
11 615
18 568
3 Yr Beta - 0.25 - 0.27 0.43 0.28
Price High 330 365 355 376 314 PER SHARE STATISTICS (cents per share)
Price Low 216 266 273 186 120 HEPS-C (ZARc) 298.60 215.50 297.30 30.90 71.30
Price Prd End 260 325 330 316 225 DPS (ZARc) 125.00 120.00 100.00 40.00 40.00
RATIOS NAV PS (ZARc) 2 185.59 2 071.01 1 947.89 1 516.16 1 560.29
Ret on SH Fnd 4.33 24.46 24.11 24.92 - 3.23 3 Yr Beta 0.30 0.73 0.91 0.87 0.76
Oper Pft Mgn 11.07 22.45 24.54 25.80 24.05 Price Prd End 2 290 1 806 1 426 1 950 1 761
D:E 1.41 1.24 1.25 1.08 1.40 Price High 2 454 2 010 2 270 2 098 2 278
Current Ratio 1.58 0.46 1.25 1.28 1.35 Price Low 1 760 1 386 1 405 1 282 1 326
Div Cover 0.28 1.78 1.71 2.13 - 0.26 RATIOS
Ret on SH Fund 13.10 11.05 13.59 2.48 1.29
Ret on Tot Ass 1.23 1.16 1.64 0.82 1.02
Debt:Equity 16.38 15.15 13.69 16.84 14.74
Solvency Mgn% 51.05 51.43 72.03 59.19 70.62
Payouts:Prem - - 0.78 0.84 0.83
145