
Page 157 - Profile's Stock Exchange Handbook -2024 Issue 4
P. 157
Profile’s Stock Exchange Handbook: 2024 – Issue 4 JSE – NIN
Ninety One Ltd. Ninety One plc
NIN NIN
ISIN: ZAE000282356 SHORT: NINETY 1L CODE: NY1 ISIN: GB00BJHPLV88 SHORT: NINETY 1P CODE: N91
REG NO: 2019/526481/06 FOUNDED: 2019 LISTED: 2020 REG NO: 12245293 FOUNDED: 2019 LISTED: 2020
NATURE OF BUSINESS: The Ninety One Group is a founder-led NATURE OF BUSINESS: The Ninety One Group is a founder-led
independent global asset manager, established in South Africa in 1991 independent global asset manager, established in South Africa in 1991
with GBP126.0 billion of assets under management (“AUM”), as at 31 with GBP126.0 billion of assets under management (“AUM”), as at 31
March 2024. Ninety One Ltd. and Ninety One plc are part of a dual listed March 2024. Ninety One Ltd. and Ninety One plc are part of a dual listed
structure andoperate as a single economic entity. It primarily offers a range structure andoperate as a single economic entity. It primarily offers a range
of high conviction, active strategies to its sophisticated global client base. of highconviction, active strategies to its sophisticated global client base.
The Ninety One Group’s investment proposition for clients centres on its The Ninety One Group’s investment proposition for clients centres on its
range of differentiated strategies managed by its specialist investment range of differentiated strategies managed by its specialist investment
teams, providing access to a diverse range of asset classes and regions teams, providing access to a diverse range of asset classes and regions
globally. globally.
SECTOR: Fins—FinServcs—InvBnkng&BrokerServcs—AssMgrs&Custodians SECTOR: Fins—FinServcs—InvBnkng&BrokerServcs—AssMgrs&Custodians
NUMBER OF EMPLOYEES: 1 187 NUMBER OF EMPLOYEES: 1 187
DIRECTORS: ArandaIFB(ind ne, Esp), CochraneVS(ind ne, UK), DIRECTORS: ArandaIFB(ind ne, Esp), CochraneVS(ind ne, UK),
KeoghCD(snr ind ne, UK), MabuzaBA(ind ne), ShuenyaneKL(ne), Keogh C D (snr ind ne, UK), Mabuza BA(ind ne), Penny G P H (ind
PennyGPH (Chair, ind ne, UK), du Toit H J (CEO), ne, UK), ShuenyaneKL(ne), du Toit H J (CEO), McFarland K (FD, UK)
McFarland K (FD, UK) MAJOR ORDINARY SHAREHOLDERS as at 09 Oct 2024
MAJOR ORDINARY SHAREHOLDERS as at 09 Oct 2024 Forty Two Point Two 33.01%
Forty Two Point Two 17.42% Public Investment Corporation (SOC) Ltd. 15.12%
Allan Gray 15.12% Investec plc 14.94%
Public Investment Corporation 12.64% POSTAL ADDRESS: 55 Gresham Street, London, EC2V 7EL
POSTAL ADDRESS: 36 Hans Strijdom Avenue, Foreshore, Cape Town, MORE INFO: www.sharedata.co.za/sdo/jse/N91
8001 COMPANY SECRETARY: Amina Rasool
MORE INFO: www.sharedata.co.za/sdo/jse/NY1 TRANSFER SECRETARY: Computershare Investor Services (Pty) Ltd.
COMPANY SECRETARY: Ninety One Africa (Pty) Ltd. SPONSOR: JP Morgan Equities South Africa (Pty) Ltd.
TRANSFER SECRETARY: Computershare Investor Services (Pty) Ltd. AUDITORS: PwC Inc.
SPONSOR: JP Morgan Equities South Africa (Pty) Ltd. CAPITAL STRUCTURE AUTHORISED ISSUED
AUDITORS: PwC Inc.
N91 Ords of GBP0.01p ea - 622 624 622
CAPITAL STRUCTURE AUTHORISED ISSUED DISTRIBUTIONS [GBPp]
NY1 Ords no par val. - 276 411 375
Ords of GBP0.01p ea Ldt Pay Amt
DISTRIBUTIONS [ZARc] FinalNo 8 16 Jul24 8 Aug 24 6.40
Ords no par val. Ldt Pay Amt Interim No 7 5 Dec 23 22 Dec 23 5.90
Final No 8 16 Jul 24 8 Aug 24 153.00
Interim No 7 5 Dec 23 22 Dec 23 136.00 LIQUIDITY: Oct24 Avg 4m shares p.w., R141.2m(29.4% p.a.)
GENF 40 Week MA NINETY 1P
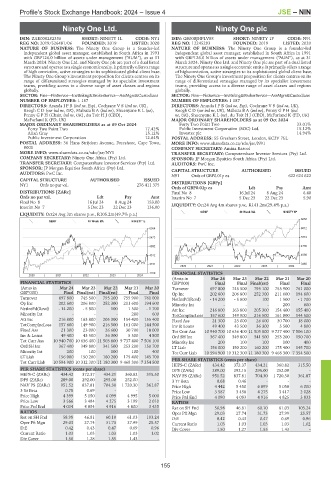
LIQUIDITY: Oct24 Avg 3m shares p.w., R105.2m(49.7% p.a.)
6650
GENF 40 Week MA NINETY 1L
6054 6012
5473 5374
4892 4736
4312 4098
3731 3460
2020 | 2021 | 2022 | 2023 | 2024
3150 FINANCIAL STATISTICS
2020 | 2021 | 2022 | 2023 | 2024
(Amts in Mar 24 Mar 23 Mar 22 Mar 21 Mar 20
FINANCIAL STATISTICS GBP’000) Final Final Final(rst) Final Final
(Amts in Mar 24 Mar 23 Mar 22 Mar 21 Mar 20 Turnover 697 800 745 500 795 100 755 900 761 000
GBP’000) Final Final(rst) Final(rst) Final Final Op Inc 202 600 206 800 252 300 211 600 194 600
Turnover 697 800 745 500 795 100 755 900 761 000 NetIntPd(Rcvd) - 14 200 - 5 800 100 1 500 - 1 700
Op Inc 202 600 206 800 252 300 211 600 194 600 Minority Int - - - 200 600
NetIntPd(Rcvd) - 14 200 - 5 800 100 1 500 - 1 700 Att Inc 216 800 163 800 205 300 154 400 155 400
Minority Int - - - 200 600 TotCompIncLoss 157 600 149 900 216 500 161 000 144 500
Att Inc 216 800 163 800 205 300 154 400 155 400 Fixed Ass 21 300 23 000 26 600 30 700 18 000
TotCompIncLoss 157 600 149 900 216 500 161 000 144 500 Inv & Loans 49 400 43 500 36 300 5 500 4 800
Fixed Ass 21 300 23 000 26 600 30 700 18 000 Tot Curr Ass 10 940 700 10 636 400 11 503 800 9 737 400 7 506 100
Inv & Loans 49 400 43 500 36 300 5 500 4 800 Ord SH Int 367 400 349 800 341 500 253 200 150 700
Tot Curr Ass 10 940 700 10 636 400 11 503 800 9 737 400 7 506 100 Minority Int 200 100 100 100 400
Ord SH Int 367 400 349 800 341 500 253 200 150 700 LT Liab 156 000 150 200 160 200 175 400 145 700
Minority Int 200 100 100 100 400 Tot Curr Liab 10 594 900 10 312 300 11 180 300 9 468 300 7 354 500
LT Liab 156 000 150 200 160 200 175 400 145 700 PER SHARE STATISTICS (cents per share)
Tot Curr Liab 10 594 900 10 312 300 11 180 300 9 468 300 7 354 500
HEPS-C (ZARc) 434.42 372.37 434.21 360.82 315.50
PER SHARE STATISTICS (cents per share) DPS (ZARc) 289.00 292.15 295.00 252.00 -
HEPS-C (ZARc) 434.42 372.37 434.21 360.82 315.50 NAV PS (ZARc) 951.52 837.81 704.30 1 720.30 361.87
DPS (ZARc) 289.00 292.00 295.00 252.00 - 3 Yr Beta 0.68 0.46 - - -
NAV PS (ZARc) 951.52 837.81 704.30 1 720.30 361.87 Price High 4 442 5 450 6 099 5 050 6 000
3 Yr Beta 0.78 0.69 - - - Price Low 3 587 3 458 4 275 3 417 2 028
Price High 4 399 5 150 6 099 4 995 5 000 Price Prd End 4 090 4 083 4 916 4 825 3 833
Price Low 3 566 3 484 4 275 3 199 2 010 RATIOS
Price Prd End 4 034 4 054 4 916 4 800 3 435 Ret on SH Fnd 58.98 46.81 60.10 61.03 103.24
RATIOS Oper Pft Mgn 29.03 27.74 31.73 27.99 25.57
Ret on SH Fnd 58.98 46.81 60.10 61.03 103.24 D:E 0.42 0.43 0.47 0.69 0.96
Oper Pft Mgn 29.03 27.74 31.73 27.99 25.57 Current Ratio 1.03 1.03 1.03 1.03 1.02
D:E 0.42 0.43 0.47 0.69 0.96 Div Cover 1.50 1.27 1.55 1.43 -
Current Ratio 1.03 1.03 1.03 1.03 1.02
Div Cover 1.50 1.28 1.55 1.43 -
155