
Page 119 - Profile's Stock Exchange Handbook -2024 Issue 4
P. 119
Profile’s Stock Exchange Handbook: 2024 – Issue 4 JSE – FIN
Finbond Group Ltd. FirstRand Ltd.
FIN FIR
ISIN: ZAE000138095 SHORT: FINBOND CODE: FGL ISIN: ZAE000066304 SHORT: FIRSTRAND CODE: FSR
REG NO: 2001/015761/06 FOUNDED: 2001 LISTED: 2007 REG NO: 1966/010753/06 FOUNDED: 1998 LISTED: 1998
NATURE OF BUSINESS: Finbond Group Ltd. is a leading international NATURE OF BUSINESS: FirstRand Ltd., through its portfolio of
Financial Services institution that specialises in the design and delivery of integrated financial services businesses, operates in South Africa, certain
unique value and solution-based savings, credit and value adding service markets in sub-Saharan Africa, the UK, and India.
solutions tailored around depositor and borrower requirements rather SECTOR: Fins—Banks—Banks—Banks
than institutional policies and practices. NUMBER OF EMPLOYEES: 49 250
SECTOR: Fins—Banks—Banks—Banks DIRECTORS: BurgerJP(ne), GelinkGG(ind ne), IsaacsTC(ind ne),
NUMBER OF EMPLOYEES: 2 210 MakosholoPJ(ind ne), NaidooPD(ind ne), Roscherr Z (ind ne),
DIRECTORS: MelvilleNJ(ind ne), Moodley T (ne), Naude P (ind ne), Sibisi DrSP(ld ind ne), von ZeunerLL(ind ne), Winterboer T (ind ne),
PentzDC(ind ne), RiskowitzSM(ne), Wilken-JonkerHJ(ne), Davias M G (Group CFO), Vilakazi M (COO)
Motlatla DrMDC (Chair, ind ne), van Aardt Dr W (CEO), MAJOR ORDINARY SHAREHOLDERS as at 30 Jun 2024
Labuschagne G (CFO) Public Investment Corporation 14.70%
MAJOR ORDINARY SHAREHOLDERS as at 29 Feb 2024 BEE Partners 4.90%
Kings Reign Investments (Pty) Ltd. 34.00% BlackRock Investment Management 3.10%
Protea Asset Management LLC 23.00% POSTAL ADDRESS: PO Box 650149, Benmore, 2010
Finbond Private Equity 16.00% MORE INFO: www.sharedata.co.za/sdo/jse/FSR
POSTAL ADDRESS: PO Box 2127, Brooklyn Square, 0075 COMPANY SECRETARY: Carnita Low
MORE INFO: www.sharedata.co.za/sdo/jse/FGL TRANSFER SECRETARY: Computershare Investor Services (Pty) Ltd.
COMPANY SECRETARY: B C Bredenkamp SPONSOR: Rand Merchant Bank (A division of FirstRand Bank Ltd.)
TRANSFER SECRETARY: JSE Investor Services (Pty) Ltd. AUDITORS: Ernst & Young Inc., PwC Inc.
SPONSOR: Grindrod Bank Ltd.
AUDITORS: BDO South Africa Inc. CAPITAL STRUCTURE AUTHORISED ISSUED
FSR Ords 1c ea 6 001 688 450 5 609 488 001
CAPITAL STRUCTURE AUTHORISED ISSUED
FGL Ords 0.0001c ea 1 000 000 000 542 720 092 DISTRIBUTIONS [ZARc]
Ords 1c ea Ldt Pay Amt
DISTRIBUTIONS [ZARc] Final No 52 8 Oct 24 14 Oct 24 215.00
Ords 0.0001c ea Ldt Pay Amt Scr/100 Interim No 51 25 Mar 24 2 Apr 24 200.00
FinalNo 7 30 Jul19 5 Aug 19 1.55 0.43 LIQUIDITY: Oct24 Avg 72m shares p.w., R5 178.0m(66.8% p.a.)
Final No 6 10 Jul 18 16 Jul 18 9.91 2.53
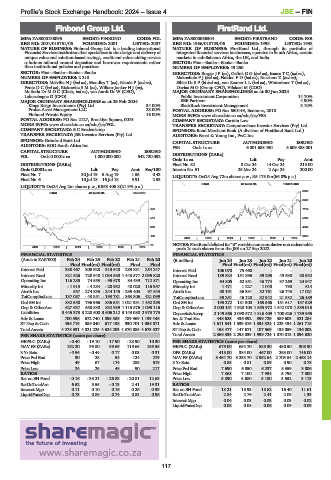
BANK 40 Week MA FIRSTRAND
LIQUIDITY: Oct24 Avg 2m shares p.w., R868 406.8(21.9% p.a.)
9695
BANK 40 Week MA FINBOND
8409
679 7122
516 5836
353 4549
189 3263
2019 | 2020 | 2021 | 2022 | 2023 | 2024
NOTES: FirstRand delisted its “B” variable non cumulative non redeemable
26
2019 | 2020 | 2021 | 2022 | 2023 | 2024
prefs 1c each shares from the JSE on 27 Sep 2022.
FINANCIAL STATISTICS FINANCIAL STATISTICS
(Amts in ZAR’000) Feb 24 Feb 23 Feb 22 Feb 21 Feb 20 (R million) Jun 24 Jun 23 Jun 22 Jun 21 Jun 20
Final Final(rst) Final(rst) Final Final Final Final(rst) Final(rst) Final(rst) Final(rst)
Interest Paid 330 467 308 928 313 548 289 831 254 247 Interest Paid 106 070 75 460 - - -
Interest Rcvd 821 526 720 948 1 034 530 1 443 577 2 095 820 Interest Rcvd 189 524 151 896 59 295 49 630 38 532
Operating Inc 116 285 74 553 - 95 678 84 439 712 871 Operating Inc 64 805 62 851 46 774 37 269 24 947
Minority Int - 1 913 - 4 284 - 28 932 40 020 116 957 Minority Int 1 471 1 227 1 040 790 614
Attrib Inc 557 - 274 835 - 244 145 - 295 403 97 643 Attrib Inc 38 191 36 331 32 761 26 743 17 021
TotCompIncLoss 137 087 - 43 851 - 193 781 - 363 806 421 099 TotCompIncLoss 39 251 46 128 32 942 21 832 26 489
Ord SH Int 832 558 796 966 836 551 1 021 931 1 452 293 Ord SH Int 195 272 181 300 165 566 151 617 137 529
Dep & OtherAcc 627 637 658 830 832 939 1 115 576 1 095 116 Dep & OtherAcc 2 003 151 1 923 103 1 655 972 1 542 078 1 535 015
Liabilities 3 446 373 3 228 600 3 606 212 3 143 080 2 973 773 Deposits&Accep 2 149 566 2 098 572 1 816 409 1 700 626 1 739 955
Adv & Loans 700 596 672 740 1 095 389 789 969 1 139 446 Inv & Trad Sec 448 625 436 392 399 729 389 603 321 284
ST Dep & Cash 455 719 585 040 617 138 930 701 1 055 871 Adv & Loans 1 611 541 1 539 375 1 334 324 1 223 434 1 261 715
Total Assets 4 278 331 4 021 225 4 624 203 4 370 085 4 673 527 ST Dep & Cash 158 477 147 671 107 569 135 059 136 002
PER SHARE STATISTICS (cents per share) Total Assets 2 369 339 2 298 039 1 999 724 1 870 013 1 894 620
HEPS-C (ZARc) - 0.40 - 19.10 - 17.90 - 23.90 10.30 PER SHARE STATISTICS (cents per share)
NAV PS (ZARc) 182.20 99.80 99.69 119.65 165.55 HEPS-C (ZARc) 679.00 654.70 585.30 480.50 308.90
3 Yr Beta - 0.56 - 0.44 0.17 0.03 0.31 DPS (ZARc) 415.00 384.00 467.00 263.00 146.00
Price Prd End 30 28 54 124 279 NAV PS (ZARc) 3 484.70 3 233.70 2 952.64 2 703.54 2 453.14
Price High 49 67 174 285 519 3 Yr Beta 0.85 0.81 0.89 0.90 0.78
Price Low 24 25 48 90 217 Price Prd End 7 690 6 850 6 237 5 359 3 806
RATIOS Price High 7 868 7 100 7 934 5 796 7 000
Ret on SH Fund - 0.16 - 35.21 - 26.83 - 20.81 12.63 Price Low 5 890 5 680 5 180 3 552 3 113
RetOnTotalAss 6.52 5.55 - 0.13 2.41 19.31 RATIOS
Interest Mgn 0.11 0.10 0.16 0.26 0.39 Ret on SH Fund 18.21 18.93 18.62 16.40 11.61
LiquidFnds:Dep 0.73 0.89 0.74 0.83 0.96 RetOnTotalAss 2.84 2.76 2.41 2.09 1.33
Interest Mgn 0.04 0.03 0.03 0.03 0.02
LiquidFnds:Dep 0.08 0.08 0.06 0.09 0.09
117