
Page 73 - shbh24_complete
P. 73
Profile’s Stock Exchange Handbook: 2024 – Issue 3 JSE – AFR
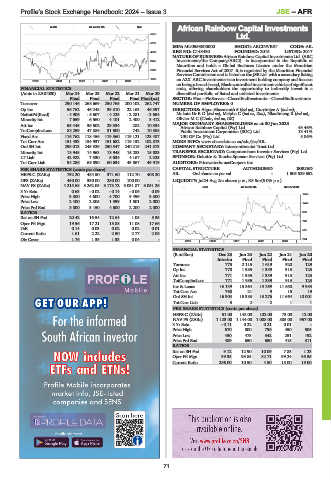
African Rainbow Capital Investments
ALSH 40 Week MA AME
Ltd.
6025
AFR
5168
ISIN: MU0553S00000 SHORT: ARCINVEST CODE: AIL
REG NO: C148430 FOUNDED: 2015 LISTED: 2017
4310
NATURE OF BUSINESS: African Rainbow Capital Investments Ltd. (ARC
3453 Investments/the Company/ARCI) is incorporated in the Republic of
Mauritius and holds a Global Business Licence under the Mauritian
2596 Financial Services Act of 2007. It is regulated by the Mauritian Financial
Services Commission and is listed on the JSE Ltd. with a secondary listing
1739 on A2X. ARC Investments is an investment holding company and focuses
2019 | 2020 | 2021 | 2022 | 2023 |
on being a broad-based, Black-controlled investment vehicle of significant
FINANCIAL STATISTICS scale, offering shareholders the opportunity to indirectly invest in a
(Amts in ZAR’000) Mar 24 Mar 23 Mar 22 Mar 21 Mar 20 diversified portfolio of listed and unlisted investments.
Final Final Final Final Final(rst) SECTOR: Fins—FinServcs—ClosedEndInvstmnts—ClosedEndInvstmnts
Turnover 290 146 268 669 250 765 200 102 262 747 NUMBER OF EMPLOYEES: 0
Op Inc 56 762 46 248 39 810 22 163 46 397 DIRECTORS: Algoo-Bissonauth S (ind ne), Currimjee A (ind ne),
NetIntPd(Rcvd) - 4 906 - 5 607 - 4 225 - 2 281 - 3 654 Mokate DrRD(ind ne), Msipha C (ind ne, Zim), Nkadimeng R (ind ne),
Olivier M C (Chair, ind ne, UK)
Minority Int 7 659 6 560 4 101 2 400 3 412 MAJOR ORDINARY SHAREHOLDERS as at 30 Jun 2023
Att Inc 55 445 36 602 29 334 282 10 334 African Rainbow Capital (Pty) Ltd. 43.46%
TotCompIncLoss 88 259 47 886 31 600 742 10 585 Public Investment Corporation (SOC) Ltd. 13.41%
Fixed Ass 116 762 118 456 119 560 119 121 123 487 UBI GP Co (Pty) Ltd. 5.86%
Tot Curr Ass 151 433 154 937 151 682 119 132 102 873 MORE INFO: www.sharedata.co.za/sdo/jse/AIL
Ord SH Int 295 013 245 926 250 547 240 215 241 873 COMPANY SECRETARY: Intercontinental Trust Ltd.
Minority Int 13 948 14 963 13 948 15 283 15 083 TRANSFER SECRETARY: Computershare Investor Services (Pty) Ltd.
LT Liab 42 922 7 530 5 634 4 167 2 325 SPONSOR: Deloitte & Touche Sponsor Services (Pty) Ltd.
Tot Curr Liab 94 286 69 890 60 634 43 067 49 919 AUDITORS: PricewaterhouseCoopers Inc.
PER SHARE STATISTICS (cents per share) CAPITAL STRUCTURE AUTHORISED ISSUED
HEPS-C (ZARc) 792.20 484.50 371.60 112.70 408.20 AIL Ord shares no par val - 1 505 529 552
DPS (ZARc) 450.00 350.00 280.00 100.00 - LIQUIDITY: Jul24 Avg 2m shares p.w., R8.5m(6.0% p.a.)
NAV PS (ZARc) 4 215.68 3 262.05 3 178.72 3 031.87 3 051.26 EQII 40 Week MA ARCINVEST
3 Yr Beta 0.63 - 0.02 - 0.14 - 0.06 0.09
Price High 3 800 4 600 4 700 9 499 3 800 1490
Price Low 2 400 2 805 1 999 1 501 2 000
1243
Price Prd End 3 800 3 150 4 600 2 200 2 000
RATIOS 996
Ret on SH Fnd 20.42 16.54 12.64 1.05 5.35
Oper Pft Mgn 19.56 17.21 15.88 11.08 17.66 748
D:E 0.14 0.03 0.02 0.02 0.01
501
Current Ratio 1.61 2.22 2.50 2.77 2.06
Div Cover 1.76 1.39 1.33 0.04 - 254
2019 | 2020 | 2021 | 2022 | 2023 |
FINANCIAL STATISTICS
(R million) Dec 23 Jun 23 Jun 22 Jun 21 Jun 20
Interim Final Final Final Final
Turnover 775 2 115 1 619 920 129
Op Inc 770 1 985 1 339 913 123
Att Inc 771 1 985 1 339 913 123
TotCompIncLoss 771 1 985 1 339 913 123
Inv & Loans 16 139 15 364 13 269 11 650 9 983
Tot Curr Ass 768 21 9 15 19
Ord SH Int 16 904 15 383 13 276 11 664 10 001
Tot Curr Liab 3 2 2 1 1
PER SHARE STATISTICS (cents per share)
HEPS-C (ZARc) 51.00 148.00 102.00 73.00 12.00
NAV PS (ZARc) 1 123.00 1 144.00 1 008.00 885.00 957.00
3 Yr Beta - 0.11 0.22 0.21 0.01 -
Price High 670 800 796 450 505
Price Low 450 473 342 251 192
Price Prd End 489 650 650 415 311
RATIOS
Ret on SH Fnd 9.12 12.90 10.09 7.83 1.23
Oper Pft Mgn 99.35 93.85 82.71 99.24 95.35
Current Ratio 256.00 10.50 4.50 15.00 19.00
71