Page 177 - shbh24_complete
P. 177

Profile’s Stock Exchange Handbook: 2024 – Issue 3                       JSE – REM
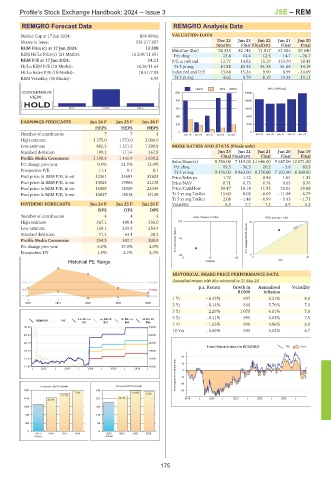
       REMGRO Forecast Data                       REMGRO Analysis Data
       Market Cap at 17 Jun 2024:        R69 899m  VALUATION DATA
       Shares in issue:                 529 217 007            Dec 23  Jun 23  Jun 22  Jun 21  Jun 20
                                                              Interim  Final Final(rst)  Final  Final
       REM Price(c) at 17 Jun 2024:       13 208
                                                  MrktCap (Rm)  92 333  82 146  71 817  63 823  55 640
       REM Hi/Lo Price(c) (24 Mnths):  16 248/11 681  Pct chng  12.4  14.4  12.5  14.7  - 26.7
       REM P/E at 17 Jun 2024:             14.11  P/E at prd end  13.77  14.82  15.19  353.70  10.43
       Hi/Lo REM P/E (18 Mnths):        16.26/11.64  Tr 5 yr avg  81.58  81.42  81.38  81.64  14.19
       Hi/Lo Index P/E (18 Mnths):      18.51/7.99  Index prd end P/E  13.64  15.26  9.90  8.99  - 24.69
       REM Volatility (36 Mnths):           6.93   Tr 5 yr avg  4.62  5.79  8.19  19.34  19.11
                                                         HEPS   DPS  (ZARc)  NAV (ZAR/cps)
       CONSENSUS                                   1200                21000
         VIEW:
                                                   960                 16800
        HOLD
                     BUY      HOLD      SELL       720                 12600
                                                   480                 8400
       EARNINGS FORECASTS  Jun 24 F  Jun 25 F  Jun 26 F
                                                   240                 4200
                            HEPS   HEPS    HEPS
       Number of contributors  7      7      4      0  Jun 19  Jun 20  Jun 21  Jun 22  Jun 23  0  Jun 19  Jun 20  Jun 21  Jun 22  Jun 23
       High estimate       1 375.0  1 573.0  2 006.0
       Low estimate         862.3  1 221.5  1 299.8  MORE RATIOS AND STATS (Finals only)
       Standard deviation   189.2   111.6  267.8               Jun 23  Jun 22  Jun 21  Jun 20  Jun 19
                                                                Final Final(rst)  Final  Final  Final
       Profile Media Consensus  1 190.4  1 445.9  1 639.2
                                                  Sales/Share(c)  8 556.00 7 419.00 11 646.00 9 687.00 10 071.00
       Pct change prev year  0.9%  21.5%   13.4%
                                                   Pct chng     15.3  - 36.3  20.2  - 3.8  83.5
       Prospective P/E       11.1    9.1    8.1
                                                   Tr 5 yr avg  9 476.00 8 863.00 8 376.00 7 103.00 6 160.00
       Fwd price: hi REM P/E, hi est  22361  25581  32623  Price/Sales ps  1.72  1.72  0.96  1.01  1.33
       Fwd price: hi REM P/E, lo est  14024  19866  21138  Price/NAV  0.71  0.73  0.74  0.65  0.76
       Fwd price: lo REM P/E, hi est  16005  18309  23349  Price/CashFlow  58.47  10.14  11.93  30.01  29.88
       Fwd price: lo REM P/E, lo est  10037  14218  15129  Tr 3 yr avg TotRet  15.60  0.08  - 6.05  - 11.08  - 6.79
                                                  Tr 5 yr avg TotRet  2.08  - 1.48  - 6.99  - 9.43  - 1.73
       DIVIDEND FORECASTS  Jun 24 F  Jun 25 F  Jun 26 F  Volatility  6.3  7.7  7.2  6.9  5.2
                             DPS    DPS     DPS
       Number of contributors  4      4      3          Risk / Return Profile  PEG inverse: 1.60
       High estimate        367.1   408.4  336.0    110                 30
       Low estimate         169.1   239.5  254.9                                     PEG = 1
       Standard deviation    71.3   63.4    38.2
       Profile Media Consensus  254.3  302.7  308.9  3Yr Compound Return  45  5 Yr Average HEPS Growth
       Pct change prev year  6.0%  19.0%   2.0%
       Prospective DY        1.9%   2.3%   2.3%
                                                    -20                 0
                                                     0      15      30   0              30
                    Historical PE Range                    Volatility           P/E
                                                  HISTORICAL SHARE PRICE PERFORMANCE DATA
                                                  Annualised returns with divs reinvested to 31 May 24
       20.66                               Avg High
                                                         p.a. Return  Grwth in  Annualised  Volatility
       15.42                               Average
                                                                     R1000  Inflation
       11.14                               Avg Low
                                                  1 Yr      - 6.33%   937    5.21%      8.0
        2020     2021    2022     2023    2024
                                                  2 Yr      - 8.14%   844    5.76%      7.3
                                                  3 Yr      2.29%    1 070   6.01%      7.0
                                                  5 Yr      - 0.11%   995    5.03%      7.5
                       Lo PE Lo  Lo PE Hi  Hi PE Lo  Hi PE Hi
           REMGRO  P/E
                        Est   Est    Est   Est
                                                  7 Yr      - 1.65%   890    4.86%      6.9
        30.07                              33000
                                                  10 Yrs    - 0.69%   933    5.03%      6.7
        26.43                              28600
        22.79                              24200
                                                            Total Return Index for REMGRO  TRI  Price
        19.15                              19800
                                                     20
        15.51                              15400
                                                   Percentage growthincluding dividends  -10
        11.87                              11000     10
          |  2022  |  2023  |  2024  |  2025  |  2026  |  0
             Forecast HEPS Growth  Forecast DPS Growth  -20
        1800                340                     -30
                      7.3%             14.6%  -2.5%
                  13.1%
        1440                272    22.7%              2019  |  2020  |  2021  |  2022  |  2023  |
               24.8%
        1080                204
        720                 136
        360                  68
         0                   0
           2023  2024  2025  2026  2023  2024  2025  2026
           Actual              Actual
                                               175
   172   173   174   175   176   177   178   179   180   181   182