
Page 133 - shbh24_complete
P. 133
Profile’s Stock Exchange Handbook: 2024 – Issue 3 JSE – ITA
Italtile Ltd. JSE Ltd.
JSE
ITA ISIN: ZAE000079711 SHORT: JSE CODE: JSE
ISIN: ZAE000099123 SHORT: ITLTILE CODE: ITE REG NO: 2005/022939/06 FOUNDED: 1887 LISTED: 2006
REG NO: 1955/000558/06 FOUNDED: 1955 LISTED: 1988 NATURE OF BUSINESS: The JSE was formed in 1887 during the first
NATURE OF BUSINESS: Founded in 1969, Italtile Ltd. is a proudly South South African gold rush. Following the first legislation covering financial
African manufacturer, franchisor and retailer of tiles, bathroomware and markets in 1947, the JSEjoinedthe World Federation of Exchanges in 1963
other complementary home-finishing products. The Group’s retail brands and upgraded to an electronic trading system in the early 1990s. The
are CTM, Italtile Retail, TopT and U-Light, represented through a total bourse demutualised and listed on its own exhange in 2005. In 2003, the
networkof216 stores,includingsevenonlinewebstores.Thebrandoffering company launched an alternative exchange, AltX, for small and mid-sized
targetshomeownersacrosstheLivingStandardsMeasure4to10categories. listings,followedbyYieldXforinterestrateandcurrency instruments.The
The retail operation is supported by a vertically integrated supply chain JSE then acquired the South African Futures Exchange (SAFEX) in 2001
comprising key manufacturing and import operations and an extensive and the Bond Exchange of South Africa (BESA) in 2009. Today it offers five
property portfolio. The manufacturers are Ceramic Industries (Pty) Ltd. financial markets namely Equities and Bonds as well as Financial,
(“Ceramic”) and Ezee Tile Adhesive Manufacturers (Pty) Ltd. (“Ezee Tile”). Commodity and Interest Rate Derivatives.
The import businesses are Cedar Point, International Tap Distributors SECTOR:Fins—FinServcs—InvBnkng&BrokerServcs—InvestmentServices
(“ITD”) and Durban Distribution Centre (“DC”).
SECTOR: ConsDiscr—Retail—Retailers—HomeImprovementRetailers NUMBER OF EMPLOYEES: 545
NUMBER OF EMPLOYEES: 2 726 DIRECTORS: BassaZBM(ind ne), ClearyMS(ind ne), Kana Dr S P
(ld ind ne), KhanyileFN(ind ne), KirkIM(ne, Ire), KrugerBJ(ne),
DIRECTORS: du ToitSM(ld ind ne), Khoza N (ind ne), Mathole A M (ind ne), Nhleko P F (Chair, ind ne), Fourie Dr L (CEO), Suliman F (CFO)
Potgieter J (ne), Pretorius S G (ind ne), Prezens L (ind ne), Ravazzotti G A MAJOR ORDINARY SHAREHOLDERS as at 19 Apr 2024
M(ne), Ravazzotti Langenhoven L (Chair, ne), Foxcroft L (CEO), Ninety One SA (Pty) Ltd. 14.79%
Booysen L (CFO), Wood B (COO) Public Investment Corporation SOC Ltd. 14.17%
MAJOR ORDINARY SHAREHOLDERS as at 30 Jun 2023 PSG Asset Management 10.02%
Rallen (Pty) Ltd. 56.46% POSTAL ADDRESS: Private Bag X991174, Sandton, 2146
Old Mutual Group 4.91% MORE INFO: www.sharedata.co.za/sdo/jse/JSE
The Italtile and Ceramic Foundation Trust 3.16%
POSTAL ADDRESS: PO Box 1689, Randburg, 2125 COMPANY SECRETARY: G A Brookes
MORE INFO: www.sharedata.co.za/sdo/jse/ITE TRANSFER SECRETARY: JSE Investor Services (Pty) Ltd.
COMPANY SECRETARY: Acorim (Pty) Ltd. SPONSOR: Rand Merchant Bank (A division of FirstRand Bank Ltd.)
TRANSFER SECRETARY: Computershare Investor Services (Pty) Ltd. AUDITORS: Ernst & Young
SPONSOR: Merchantec Capital (Pty) Ltd. CAPITAL STRUCTURE AUTHORISED ISSUED
AUDITORS: PwC Inc. JSE Ords 10c ea 400 000 000 86 355 491
CAPITAL STRUCTURE AUTHORISED ISSUED DISTRIBUTIONS [ZARc]
ITE Ords no par value 3 300 000 000 1 321 654 148 Ords 10c ea Ldt Pay Amt
Final No 21 9 Apr 24 15 Apr 24 784.00
DISTRIBUTIONS [ZARc]
Ords no par value Ldt Pay Amt Final No 20 28 Mar 23 3 Apr 23 769.00
Interim No 115 5 Mar 24 11 Mar 24 27.00 LIQUIDITY: Jul24 Avg 554 357 shares p.w., R51.8m(33.4% p.a.)
Final No 114 12 Sep 23 18 Sep 23 21.00
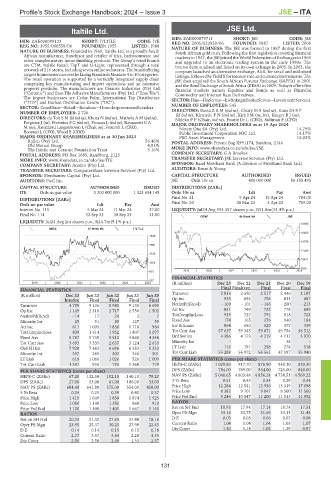
GENF 40 Week MA JSE
LIQUIDITY: Jul24 Avg 2m shares p.w., R24.7m(9.1% p.a.)
18945
GERE 40 Week MA ITLTILE
16826
1849
14708
1591
12589
1332
10471
1074
8352
815 2019 | 2020 | 2021 | 2022 | 2023 | 2024
FINANCIAL STATISTICS
557
2019 | 2020 | 2021 | 2022 | 2023 | 2024 (R million) Dec 23 Dec 22 Dec 21 Dec 20 Dec 19
Final Final(rst) Final Final Final
FINANCIAL STATISTICS
(R million) Dec 23 Jun 23 Jun 22 Jun 21 Jun 20 Turnover 2 814 2 650 2 517 2 446 2 187
Interim Final Final Final Final Op Inc 933 894 798 811 687
Turnover 4 798 9 136 8 981 9 135 6 690 NetIntPd(Rcvd) - 169 - 101 - 146 - 200 - 213
Op Inc 1 149 2 318 2 717 2 556 1 502 Att Inc 831 749 722 778 695
TotCompIncLoss 919 727 791 818 723
NetIntPd(Rcvd) - 14 17 24 2 7
Minority Int 25 51 85 127 59 Fixed Ass 174 165 176 140 184
Att Inc 811 1 605 1 850 1 718 964 Inv & Loans 864 650 529 377 339
TotCompIncLoss 839 1 614 1 952 1 807 1 077 Tot Curr Ass 57 637 59 345 59 071 49 754 38 512
Fixed Ass 5 787 5 739 5 512 4 866 4 248 Ord SH Int 4 386 4 173 4 219 4 117 3 970
Tot Curr Ass 3 693 3 335 2 637 3 124 2 610 Minority Int - - - 38 -
Ord SH Int 7 928 7 483 6 696 6 353 5 333 LT Liab 116 191 258 274 318
Minority Int 297 285 302 360 301 Tot Curr Liab 55 288 56 972 56 561 47 197 35 940
LT Liab 618 1 066 1 026 526 1 009 PER SHARE STATISTICS (cents per share)
Tot Curr Liab 1 331 935 725 1 368 779 HEPS-C (ZARc) 1 029.80 917.70 878.90 940.10 820.30
PER SHARE STATISTICS (cents per share) DPS (ZARc) 784.00 769.00 854.00 725.00 840.00
HEPS-C (ZARc) 67.20 132.30 152.10 140.10 79.20 NAV PS (ZARc) 5 048.65 4 803.48 4 856.24 4 738.51 4 569.22
DPS (ZARc) 27.00 53.00 61.00 106.00 33.00 3 Yr Beta 0.51 0.43 0.34 0.29 0.34
NAV PS (ZARc) 684.40 641.80 575.00 554.00 458.00 Price High 12 284 12 541 12 936 13 319 17 098
3 Yr Beta 0.24 0.25 0.39 0.40 0.37 Price Low 8 382 9 701 9 841 8 500 11 500
Price High 1 419 1 649 1 858 1 874 1 525 Price Prd End 9 244 10 847 11 200 11 513 11 952
Price Low 1 050 1 140 1 351 968 910 RATIOS
Price Prd End 1 120 1 300 1 401 1 667 1 150 Ret on SH Fnd 18.95 17.94 17.14 18.74 17.51
RATIOS Oper Pft Mgn 33.16 33.75 31.69 33.14 31.43
Ret on SH Fnd 20.33 21.32 27.65 27.48 18.16 D:E 0.03 0.05 0.06 0.07 0.08
Oper Pft Mgn 23.95 25.37 30.25 27.98 22.45 Current Ratio 1.04 1.04 1.04 1.05 1.07
D:E 0.14 0.14 0.15 0.15 0.18 Div Cover 1.30 1.18 1.02 1.29 0.97
Current Ratio 2.77 3.57 3.64 2.28 3.35
Div Cover 2.50 2.50 2.49 1.33 2.37
131