
Page 130 - shbh24_complete
P. 130
JSE – IMP Profile’s Stock Exchange Handbook: 2024 – Issue 3
Impala Platinum Holdings Ltd. Insimbi Industrial Holdings Ltd.
IMP INS
ISIN: ZAE000083648 ISIN: ZAE000116828
SHORT: IMPLATS SHORT: INSIMBI
CODE: IMP CODE: ISB
REG NO: 1957/001979/06 REG NO: 2002/029821/06
FOUNDED: 1957 FOUNDED: 2008
LISTED: 1973 LISTED: 2008
NATURE OF BUSINESS: Impala Platinum Holdings Ltd. is principally in NATURE OF BUSINESS: Insimbi is a group of companies that sustainably
the businessofproducing andsupplying platinumgroup metals(PGMs)to source, process, beneficiate & recycle metals. The core business expertise
industrial economies. is the ability to source and provide local, regional and global industrial
SECTOR:BasicMaterials—BasicResrcs—PreciousMet&Min—Plat&PrecMet consumers with the required commodity over its four distinct business
NUMBER OF EMPLOYEES: 67 973 segments.
DIRECTORS: Earp D (ind ne), Havenstein R (ind ne), KoshaneBT(ne), SECTOR:BasicMaterials—BasicResrcs—IndMet&Min—NonferrousMet
Mawasha B (ind ne), Moshe M (ind ne), Mufamadi DrFS(ind ne), NUMBER OF EMPLOYEES: 508
NkeliMEK(ind ne), Samuel L, Speckmann P (ind ne), DIRECTORS: Winde N (CFO), Botha F (CEO),
SwanepoelBZ(ld ind ne), Orleyn AdvNDB (Chair, ind ne), Dickerson R I (Chair, ld ind ne), Mwale N (ne), NtshingilaCS(ind ne)
Muller N J (CEO), Kerber M (CFO) MAJOR ORDINARY SHAREHOLDERS as at 29 Feb 2024
MAJOR ORDINARY SHAREHOLDERS as at 31 May 2024 NS Investco 21.74%
Public Investment Corporation 14.21% African Goshawk (Pty) Ltd. 9.77%
FMR LLC 9.53% Pruta Securities 9.12%
Lingotto 5.63% POSTAL ADDRESS: PO Box 14676, Wadeville, 1422
POSTAL ADDRESS: Private Bag X18, Northlands, 2116 EMAIL: cosec@insimbi-alloys.co.za
EMAIL: investor@implats.co.za WEBSITE: insimbi-group.co.za
WEBSITE: www.implats.co.za TELEPHONE: 011-902-6930 FAX: 011-902-5749
TELEPHONE: 011-731-9000 COMPANY SECRETARY: Matseliso Madhlophe
COMPANY SECRETARY: Tebogo Llale TRANSFER SECRETARY: Computershare Investor Services (Pty) Ltd.
TRANSFER SECRETARY: Computershare Investor Services (Pty) Ltd. SPONSOR: PSG Capital (Pty) Ltd.
SPONSOR: Nedbank Corporate and Investment Banking AUDITORS: Moore Cape Town Inc.
AUDITORS: Deloitte & Touche CAPITAL STRUCTURE AUTHORISED ISSUED
CAPITAL STRUCTURE AUTHORISED ISSUED ISB Ords 0.000025c ea 12 000 000 000 377 198 097
IMP Ords no par value 944 008 000 904 368 485
DISTRIBUTIONS [ZARc]
DISTRIBUTIONS [ZARc] Ords 0.000025c ea Ldt Pay Amt
Ords no par value Ldt Pay Amt Interim No 22 14 Nov 23 20 Nov 23 2.50
Final No 99 19 Sep 23 26 Sep 23 165.00 Final No 21 4 Jul 23 10 Jul 23 5.00
Interim No 98 20 Mar 23 27 Mar 23 420.00
LIQUIDITY: Jun24 Avg 237 227 shares p.w., R225 751.6(3.3% p.a.)
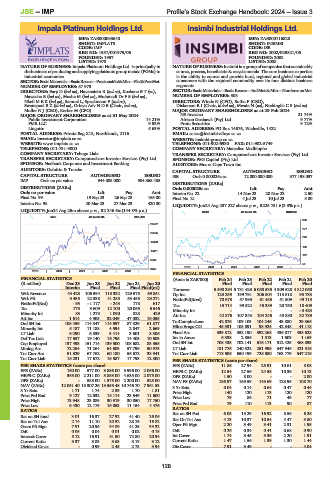
LIQUIDITY: Jun24 Avg 25m shares p.w., R2 246.6m(144.8% p.a.)
INDM 40 Week MA INSIMBI
MINI 40 Week MA IMPLATS
333
28597
277
23535
220
18473
163
13411
107
8349
50
2019 | 2020 | 2021 | 2022 | 2023 |
3287
2019 | 2020 | 2021 | 2022 | 2023 |
FINANCIAL STATISTICS
FINANCIAL STATISTICS (Amts in ZAR’000) Feb 24 Feb 23 Feb 22 Feb 21 Feb 20
(R million) Dec 23 Jun 23 Jun 22 Jun 21 Jun 20 Final Final Final Final Final
Interim Final Final Final Final(rst) Turnover 5 590 294 5 731 423 6 058 535 4 909 528 4 812 068
Wrk Revenue 43 425 106 594 118 332 129 575 69 851 Op Inc 123 259 199 791 206 504 113 518 93 733
Wrk Pft 3 435 22 338 41 285 53 455 23 271 NetIntPd(Rcvd) 70 673 57 993 61 483 51 509 49 115
NetIntPd(Rcd) - 93 - 1 177 - 243 178 617 Tax 15 714 39 522 45 389 20 750 18 409
Tax 175 3 609 12 100 20 065 6 546
Minority Int 83 1 273 1 090 823 429 Minority Int 42 876 - 107 343 - 104 246 - 43 880 - - 3 423
Att Inc
32 789
Att Inc 1 614 4 905 32 049 47 032 16 055
Ord SH Int 108 459 114 847 114 697 87 829 61 877 TotCompIncLoss 42 876 109 103 104 246 43 880 29 366
Minority Int 5 187 11 188 4 594 2 847 2 669 Hline Erngs-CO 45 331 105 891 98 924 42 848 41 118
LT Liab 6 290 6 539 3 414 3 601 8 306 Fixed Ass 339 812 352 190 392 268 436 017 458 628
Def Tax Liab 17 557 19 140 16 795 14 405 10 503 Inv in Assoc 6 338 2 856 1 513 1 609 1 169
Cap Employed 137 493 151 714 139 500 108 682 83 355 Ord SH Int 708 435 702 141 616 171 512 425 468 893
Mining Ass 72 254 71 264 64 603 57 799 50 975 LT Liab 181 776 240 522 251 998 347 946 421 516
Tot Curr Ass 51 329 67 762 60 180 56 672 38 941 Tot Curr Liab 713 506 650 199 728 580 763 779 547 216
Tot Curr Liab 15 231 17 672 16 587 17 793 12 500 PER SHARE STATISTICS (cents per share)
PER SHARE STATISTICS (cents per share) EPS (ZARc) 11.86 27.94 25.91 10.61 8.08
EPS (ZARc) 180.00 577.00 3 856.00 5 996.00 2 066.00 HEPS-C (ZARc) 12.54 27.56 24.58 10.36 10.13
HEPS-C (ZARc) 365.00 2 211.00 3 853.00 4 635.00 2 075.00 DPS (ZARc) 1.50 8.00 - - 2.00
DPS (ZARc) - 585.00 1 575.00 2 200.00 525.00 NAV PS (ZARc) 186.97 169.59 143.69 123.95 108.70
NAV (ZARc) 12 051.40 13 307.26 13 555.48 10 746.70 7 961.53 3 Yr Beta 0.04 0.14 0.64 0.47 0.44
3 Yr Beta 1.71 1.74 2.39 1.70 1.81 Price High 140 120 113 120 120
Price Prd End 9 127 12 532 18 114 23 549 11 600 Price Low 79 86 71 49 77
Price High 13 948 23 889 30 919 30 050 17 750
Price Low 6 430 12 179 16 053 11 154 4 476 Price Prd End 79 110 113 90 87
RATIOS
RATIOS
Ret on SH fund 3.01 16.37 27.92 41.40 26.06 Ret on SH Fnd 6.05 15.29 16.92 8.56 6.26
Ret on Tot Ass 2.14 11.10 20.52 28.75 16.82 Ret On Tot Ass 4.13 10.37 10.54 4.47 3.80
Gross Pft Mgn 7.91 20.96 34.89 41.25 33.32 Oper Pft Mgn 2.20 3.49 3.41 2.31 1.95
D:E 0.05 0.04 0.01 0.02 0.15 D:E 0.26 0.34 0.41 0.68 0.90
Interest Cover 5.12 16.91 81.50 72.80 20.94 Int Cover 1.74 3.45 3.36 2.20 1.91
Current Ratio 3.37 3.83 3.63 3.19 3.12 Current Ratio 1.47 1.56 1.39 1.30 1.44
Dividend Cover - 0.99 2.45 2.73 3.94 Div Cover 7.91 3.49 - - 4.04
128