
Page 207 - Profile's Stock Exchange Handbook - 2025 Issue 4
P. 207
Profile’s Stock Exchange Handbook: 2025 - Issue 4 JSE - THU
Thungela Resources Ltd. Tiger Brands Ltd.
ISIN: ZAE000296554 SHORT: THUNGELA CODE: TGA ISIN: ZAE000071080 SHORT: TIGBRANDS CODE: TBS
REG NO: 2021/303811/06 FOUNDED: 2020 LISTED: 2021 REG NO: 1944/017881/06 FOUNDED: 1921 LISTED: 1944
NATURE OF BUSINESS: Thungela, which means ‘to ignite’ in isiZulu, NATURE OF BUSINESS: Tiger Brands is one of Africa’s largest, listed
is a global pure-play producer and exporter of high-quality, manufacturers of fast-moving consumer goods (FMCG). Its core
cost-competitive thermal coal, with operations in South Africa business is manufacturing, marketing and distributing everyday
and Australia. Thungela’s quality coal reserves and marketable branded food and beverages. Tiger Brands’ products are relevant
production, positions Thungela as a key player in the global energy across every meal occasion and are well positioned to grow. The
market as it delivers coal through world-class ports, powering portfolio also includes leading brands in the home and personal
nations. care segments and Tiger Brands have a growing presence in Africa.
SECTOR: Energy--Energy--OilGas&Coal--Coal SECTOR: CnsStp--FoodBev&Tob--Food Producers--Food Products
NUMBER OF EMPLOYEES: 4 754 NUMBER OF EMPLOYEES: 8 785
DIRECTORS: French S G (ind ne), Jekwa Dr N Y (ind ne), Kodisang B M DIRECTORS: Braeken F (ld ind ne, Belgium), Mashilwane E (ind ne),
(ld ind ne), McKeith T D (ind ne), Mzondeki K (ind ne), Ntsaluba S S Sello Adv M (ind ne), Sithole S (ne), Swartz L (ind ne), Weber O M
(Chair, ind ne), Moses M (CEO), Ndlovu J (CEO), Smith D (CFO) (ind ne), Wilson D G (ind ne), Fraser-Moleketi G J (Chair, ind ne),
MAJOR ORDINARY SHAREHOLDERS as at 10 Oct 2025 Kruger T N (CEO), Govender T (CFO)
Allan Gray (Pty) Ltd. 10.02% MAJOR ORDINARY SHAREHOLDERS as at 13 Jun 2025
Public Investment Corporation (SOC) Ltd. 9.81% Public Investment Corporation (SOC) Ltd. 15.37%
Anglo American 7.96% Silchester International Investors LLP 14.93%
POSTAL ADDRESS: PO Box 1521, Saxonwold, 2132 Government Employees Pension Fund 14.57%
MORE INFO: www.sharedata.co.za/sdo/jse/TGA POSTAL ADDRESS: PO Box 78056, Sandton, 2146
COMPANY SECRETARY: Altovise Alaxa Ellis MORE INFO: www.sharedata.co.za/sdo/jse/TBS
TRANSFER SECRETARY: Computershare Investor Services (Pty) Ltd. COMPANY SECRETARY: Kgosi Monaisa
SPONSOR: Rand Merchant Bank (A division of FirstRand Bank Ltd. (SA)) TRANSFER SECRETARY: Computershare Investor Services (Pty) Ltd.
AUDITORS: PwC Inc. SPONSOR: JP Morgan Equities South Africa Ltd.
CAPITAL STRUCTURE Authorised Issued AUDITORS: Deloitte & Touche Inc.
TGA Ords no par val 10 000 000 000 140 492 585 CAPITAL STRUCTURE Authorised Issued
DISTRIBUTIONS [ZARc] TBS Ords 10c ea 250 000 000 174 871 708
Ords no par val Ldt Pay Amt DISTRIBUTIONS [ZARc]
Interim No 8 16 Sep 25 22 Sep 25 200.00 Ords 10c ea Ldt Pay Amt
Final No 7 22 Apr 25 29 Apr 25 1100.00 Interim No 159 1 Jul 25 7 Jul 25 415.00
LIQUIDITY: Oct25 Avg 4m shares p.w., R372.9m(132.4% p.a.) Special No 3 1 Jul 25 7 Jul 25 1216.00
LIQUIDITY: Oct25 Avg 3m shares p.w., R761.1m(77.6% p.a.)
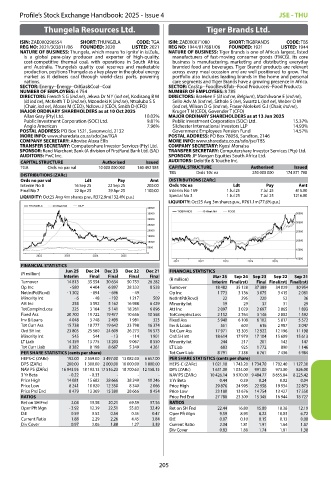
THUNGELA 40 Week MA OILP
40000
TIGBRANDS 40 Week MA FOOD
35000 35000
30000
30000
25000
20000 25000
15000
20000
10000
5000
15000
0
2022 2023 2024 2025
10000
2021 2022 2023 2024 2025
FINANCIAL STATISTICS
Jun 25 Dec 24 Dec 23 Dec 22 Dec 21 FINANCIAL STATISTICS
(R million)
Interim Final Final Final Final Mar 25 Sep 24 Sep 23 Sep 22 Sep 21
Turnover 14 813 35 554 30 634 50 753 26 282 (R million) Interim Final(rst) Final Final(rst) Final(rst)
Op Inc - 580 4 404 6 897 28 333 8 538 Turnover 18 482 35 128 37 389 34 029 30 954
NetIntPd(Rcvd) - 1 302 - 894 - 696 - 49 - Op Inc 1 773 3 136 3 075 3 415 2 081
Minority Int - 6 - 48 - 192 1 217 509 NetIntPd(Rcvd) 22 295 220 52 36
Att Inc 254 3 592 5 162 16 988 6 429 Minority Int 19 29 37 31 29
TotCompIncLoss 225 3 164 5 141 18 261 6 896 Att Inc 2 097 3 029 2 697 2 865 1 893
Fixed Ass 20 700 19 722 19 477 10 656 10 568 TotCompIncLoss 2 152 2 764 3 146 2 802 1 592
Inv & Loans 4 048 3 748 2 499 1 981 323 Fixed Ass 5 940 6 108 6 102 5 817 5 572
Tot Curr Ass 15 738 18 777 19 642 23 798 16 374 Inv & Loans 551 603 616 2 987 3 047
Ord SH Int 23 805 25 560 24 609 26 273 16 573 Tot Curr Ass 17 971 13 303 12 922 12 196 11 198
Minority Int 545 544 - 13 - 114 1 901 Ord SH Int 18 614 17 979 17 104 15 609 15 613
LT Liab 14 359 13 775 13 203 9 067 8 550 Minority Int 244 217 201 142 147
Tot Curr Liab 8 382 8 198 8 687 5 349 4 261 LT Liab 683 925 1 772 890 1 146
PER SHARE STATISTICS (cents per share) Tot Curr Liab 8 791 7 338 6 761 7 436 5 984
HEPS-C (ZARc) 192.00 2 559.00 3 497.00 13 082.00 6 657.00 PER SHARE STATISTICS (cents per share)
DPS (ZARc) 200.00 1 300.00 2 000.00 10 000.00 1 800.00 HEPS-C (ZARc) 1 021.10 1 743.20 1 734.70 1 702.40 1 127.30
NAV PS (ZARc) 16 943.95 18 193.13 17 516.23 18 700.63 12 158.15 DPS (ZARc) 1 631.00 1 034.00 991.00 973.00 826.00
3 Yr Beta - 0.22 - 0.33 - - - NAV PS (ZARc) 10 426.14 9 970.00 9 484.77 8 655.84 8 225.42
Price High 14 081 15 682 28 666 38 249 10 246 3 Yr Beta 0.44 0.39 0.24 0.02 0.04
Price Low 8 241 10 020 12 350 8 340 2 066 Price High 29 876 24 995 22 958 19 934 22 873
Price Prd End 8 479 13 369 15 380 28 666 8 454 Price Low 23 180 13 676 14 754 13 427 17 550
RATIOS Price Prd End 27 788 23 300 15 345 16 944 18 727
Ret on SH Fnd 2.04 13.58 20.21 69.59 37.56 RATIOS
Oper Pft Mgn - 3.92 12.39 22.51 55.83 32.49 Ret on SH Fnd 22.44 16.80 15.80 18.38 12.19
D:E 0.59 0.53 0.54 0.35 0.47 Oper Pft Mgn 9.59 8.93 8.22 10.03 6.72
Current Ratio 1.88 2.29 2.26 4.45 3.84 D:E 0.07 0.10 0.15 0.13 0.08
Div Cover 0.97 2.06 1.88 1.27 3.39 Current Ratio 2.04 1.81 1.91 1.64 1.87
Div Cover 0.83 1.88 1.74 1.81 1.38
205