
Page 212 - Profile's Stock Exchange Handbook - 2025 Issue 4
P. 212
JSE - VOD Profile’s Stock Exchange Handbook: 2025 - Issue 4
Vodacom Group Ltd. Vukile Property Fund Ltd.
ISIN: ZAE000132577 SHORT: VODACOM CODE: VOD ISIN: ZAE000056370 SHORT: VUKILE CODE: VKE
REG NO: 1993/005461/06 FOUNDED: 1993 LISTED: 2009 REG NO: 2002/027194/06 FOUNDED: 2004 LISTED: 2004
NATURE OF BUSINESS: Vodacom is a leading, purpose-driven NATURE OF BUSINESS: Vukile Property Fund Ltd. (Vukile, the
African operator providing connectivity, digital and financial company or the group) is a high-quality, low-risk and retail-focused
services to 211.3 million customers, including those served Real Estate Investment Trust (REIT), which listed on the JSE Ltd.
through Safaricom. Building on more than 30 years in the on 24 June 2004 (JSE code: VKE) and on the Namibia Securities
telecommunications industry, Vodacom has grown beyond South Exchange (NSX) on 11 July 2007 (NSX code: VKN). Vukile’s market
Africa to include controlled operations in DRC, Egypt, Lesotho, capitalisation was R21.7 billion on 31 March 2025 and its direct
Mozambique and Tanzania, with an associate holding in Safaricom property portfolio was valued at R48.4 billion.
providing exposure to Ethiopia and Kenya. SECTOR: RealEstate--RealEstate--REITS--Retail
SECTOR: Telecoms--Telecoms--TelecomServiceProvider--TelecomServices NUMBER OF EMPLOYEES: 82
NUMBER OF EMPLOYEES: 16 999 DIRECTORS: Dongwana N P (ind ne), Formby J (ind ne), Zehner J (ind ne),
DIRECTORS: Govinda S K (ne), Kamath G S (ind ne), Klotz P (ne), Pottas L (FD), Rapp L (CEO), Mothibeli I, Payne N G (Chair, ind ne),
Ludlow J (alt), Mahanyele-Dabengwa P (ind ne), Nqweni N (alt), Kodisang B M (ne), Mokate Dr R D (ld ind ne), Mokgabudi T (ind ne),
Otty J (ne, British), Reiter J (ne), Shuenyane K L (ld ind ne), Moseneke Dr G S (ne)
Thomson C B (ind ne), Wood L (ne), Macozoma S (Chair, ind ne), MAJOR ORDINARY SHAREHOLDERS as at 22 Oct 2025
Joosub M S (CEO), Morathi R K (CFO) Public Investment Corporation 20.22%
MAJOR ORDINARY SHAREHOLDERS as at 31 Mar 2025 Truffle Asset Management (Pty) Ltd. 5.38%
Vodafone Group plc 65.10% Ninety One SA (Pty) Ltd. 5.02%
Government Employees Pension Fund 12.24% POSTAL ADDRESS: PO Box 2779, Saxonworld, 2132
YeboYethu Investment Company (RF) (Pty) Ltd. 5.51% MORE INFO: www.sharedata.co.za/sdo/jse/VKE
POSTAL ADDRESS: Private Bag X9904, Sandton, 2146 COMPANY SECRETARY: Johann Neethling
MORE INFO: www.sharedata.co.za/sdo/jse/VOD TRANSFER SECRETARY: JSE Investor Services (Pty) Ltd.
COMPANY SECRETARY: Karen Robinson SPONSOR: Java Capital (Pty) Ltd.
TRANSFER SECRETARY: Computershare Investor Services (Pty) Ltd. AUDITORS: PwC Inc.
SPONSOR: Investec Bank Ltd. CAPITAL STRUCTURE Authorised Issued
AUDITORS: Ernst & Young VKE Ords no par val 1 500 000 000 1 244 630 392
CAPITAL STRUCTURE Authorised Issued DISTRIBUTIONS [ZARc]
VOD Ords no par val 4 000 000 000 2 077 841 204 Ords no par val Ldt Pay Amt
DISTRIBUTIONS [ZARc] Final No 42 1 Jul 25 7 Jul 25 76.54
Ords no par val Ldt Pay Amt Interim No 41 10 Dec 24 17 Dec 24 55.18
Final No 32 17 Jun 25 23 Jun 25 335.00 LIQUIDITY: Oct25 Avg 12m shares p.w., R238.4m(51.5% p.a.)
Interim No 31 26 Nov 24 2 Dec 24 285.00
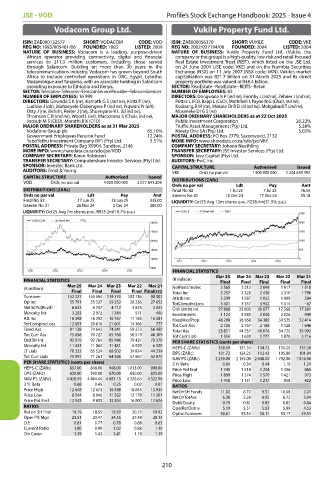
LIQUIDITY: Oct25 Avg 7m shares p.w., R925.2m(18.7% p.a.) VUKILE 40 Week MA REIV 2500
VODACOM 40 Week MA FTEL
30000 2000
25000 1500
20000 1000
15000 500
10000 0
2021 2022 2023 2024 2025
5000
2021 2022 2023 2024 2025 FINANCIAL STATISTICS
Mar 25 Mar 24 Mar 23 Mar 22 Mar 21
FINANCIAL STATISTICS (R million) Final Final Final Final Final
Mar 25 Mar 24 Mar 23 Mar 22 Mar 21
(R million) NetRent/InvInc 2 565 2 212 2 049 1 917 1 510
Final Final Final Final Final(rst) Total Inc 3 257 2 328 2 416 2 310 1 796
Turnover 152 227 150 594 119 170 102 736 98 302 Attrib Inc 3 209 1 587 1 932 1 909 584
Op Inc 35 791 35 337 29 252 28 236 27 652 TotCompIncLoss 3 401 3 337 3 952 1 314 - 67
NetIntPd(Rcvd) 6 633 6 747 4 712 3 675 3 423 Ord UntHs Int 27 868 23 803 20 077 17 568 17 361
Minority Int 3 293 2 972 1 344 571 490 Investments 1 124 3 545 2 046 2 026 949
Att Inc 16 598 16 292 16 767 17 163 16 581 FixedAss/Prop 48 298 36 568 34 380 30 535 32 414
TotCompIncLoss 12 691 20 616 21 601 14 366 777 Tot Curr Ass 2 726 2 767 2 168 1 128 1 646
Fixed Ass 81 138 74 643 74 241 59 273 56 480 Total Ass 53 821 44 237 40 076 34 725 35 992
Tot Curr Ass 75 656 70 727 65 788 50 519 46 309 Tot Curr Liab 1 554 1 630 1 777 1 878 3 716
Ord SH Int 92 019 92 764 85 946 79 437 79 370 PER SHARE STATISTICS (cents per share)
Minority Int 11 633 11 064 11 481 6 029 6 320 HEPS-C (ZARc) 158.59 131.34 134.72 134.25 137.26
LT Liab 70 332 65 524 66 502 34 834 44 219 DPS (ZARc) 131.72 124.25 112.43 105.80 101.04
Tot Curr Liab 75 997 71 261 64 386 57 667 42 070 NAV PS (ZARc) 2 239.00 2 155.00 2 048.00 1 792.00 1 816.00
PER SHARE STATISTICS (cents per share) 3 Yr Beta 0.64 0.34 0.44 1.19 1.24
HEPS-C (ZARc) 857.00 846.00 948.00 1 013.00 980.00 Price Prd End 1 745 1 518 1 244 1 406 865
DPS (ZARc) 620.00 590.00 670.00 850.00 825.00 Price High 1 899 1 574 1 570 1 421 973
NAV PS (ZARc) 4 428.59 4 464.44 4 681.15 4 326.63 4 322.98 Price Low 1 418 1 151 1 217 858 422
3 Yr Beta 0.68 0.45 0.25 0.02 0.07 RATIOS
Price High 12 648 12 673 16 348 16 045 13 935 RetOnSH Funds 11.02 6.72 9.51 10.68 2.21
Price Low 8 544 8 946 11 562 12 178 11 201 RetOnTotAss 6.38 5.28 6.05 6.72 5.04
Price Prd End 12 545 9 855 12 204 16 000 12 626 Debt:Equity 0.79 0.81 0.83 0.82 0.84
RATIOS OperRetOnInv 5.19 5.51 5.63 5.89 4.53
Ret on SH Fnd 19.19 18.55 18.59 20.75 19.92 OpInc:Turnover 56.61 55.54 56.11 55.17 49.51
Oper Pft Mgn 23.51 23.47 24.55 27.48 28.13
D:E 0.81 0.77 0.78 0.68 0.63
Current Ratio 1.00 0.99 1.02 0.88 1.10
Div Cover 1.39 1.43 1.41 1.19 1.19
210