
Page 215 - Profile's Stock Exchange Handbook - 2025 Issue 4
P. 215
Profile’s Stock Exchange Handbook: 2025 - Issue 4 JSE - WIL
Wilson Bayly Holmes - Ovcon Ltd. Woolworths Holdings Ltd.
ISIN: ZAE000009932 SHORT: WBHO CODE: WBO ISIN: ZAE000063863 SHORT: WOOLIES CODE: WHL
REG NO: 1982/011014/06 FOUNDED: 1975 LISTED: 1988 REG NO: 1929/001986/06 FOUNDED: 1929 LISTED: 1997
NATURE OF BUSINESS: WBHO is one of the largest construction NATURE OF BUSINESS: Woolworths Holdings Ltd. (WHL or the
companies in southern Africa and is listed on the Johannesburg Group) is a major retail group with a presence in South Africa,
Stock Exchange. WBHO’s vision is to be the leading construction Australia, New Zealand, and 10 sub-Saharan African countries. The
company wherever it operate. The driving force behind WBHO Group consists of two omnichannel segments, Woolworths South
is a core of dedicated, hands-on management professionals Africa (Woolworths or WSA) and Country Road Group (CRG).
whose experience spans decades of major construction projects. SECTOR: ConsDiscr--Retail--Retailers--DiversifiedRetailers
Construction activities, that cover the full construction spectrum, NUMBER OF EMPLOYEES: 40 168
are divided into three main operating divisions: Building DIRECTORS: Bam L L (ind ne), Colfer C (ind ne, Canada), Collins R (ind ne),
construction, Civil engineering and Roads and earthworks. WBHO’s Earl B (ind ne, British), Gwagwa Dr N (ind ne), Kgaboesele I (ind ne),
African offices are strategically located in Johannesburg, Cape Moholi N T (ld ind ne), Skweyiya T (ind ne), Thomson C B (ind ne),
Town, Durban and Gqeberha in South Africa as well as Gaborone in Bagattini R (CEO), Manjra Z (Group FD), Ngumeni S (COO)
Botswana, Maputo in Mozambique, and Accra in Ghana. MAJOR ORDINARY SHAREHOLDERS as at 17 Sep 2025
SECTOR: Inds--Constr&Mats--Constr&Mats--Construction Public Investment Corporation (SOC) Ltd. 20.25%
NUMBER OF EMPLOYEES: 9 082 Allan Gray 17.40%
DIRECTORS: Bester C (ind ne), Forbay K (ind ne), Gardiner R (ld ind ne), Ninety One SA (Pty) Ltd. 7.10%
Ntene H (ind ne), Sonqushu N (ind ne), Henwood C V (Chair), POSTAL ADDRESS: PO Box 680, Cape Town, 8000
Neff W (CEO), Logan A C (CFO) MORE INFO: www.sharedata.co.za/sdo/jse/WHL
MAJOR ORDINARY SHAREHOLDERS as at 7 Oct 2025 COMPANY SECRETARY: Chantel Reddiar
Public Investment Corporation SOC Ltd. 20.47% TRANSFER SECRETARY: Computershare Investor Services (Pty) Ltd.
Akani 2 20.43% SPONSOR: Investec Bank Ltd.
WBHO Management Trust 9.95% AUDITORS: KPMG Inc.
POSTAL ADDRESS: PO Box 531, Bergvlei, 2012 CAPITAL STRUCTURE Authorised Issued
MORE INFO: www.sharedata.co.za/sdo/jse/WBO WHL Ords no par val 2 410 600 000 983 521 311
COMPANY SECRETARY: Donna Msiska
TRANSFER SECRETARY: Computershare Investor Services (Pty) Ltd. DISTRIBUTIONS [ZARc]
SPONSOR: Investec Bank Ltd. Ords no par val Ldt Pay Amt
AUDITORS: PwC Inc. Final No 46 22 Sep 25 29 Sep 25 81.00
CAPITAL STRUCTURE Authorised Issued Interim No 45 25 Mar 25 31 Mar 25 107.00
WBO Ords 1c ea 100 000 000 71 018 425 LIQUIDITY: Oct25 Avg 21m shares p.w., R1 158.3m(111.7% p.a.)
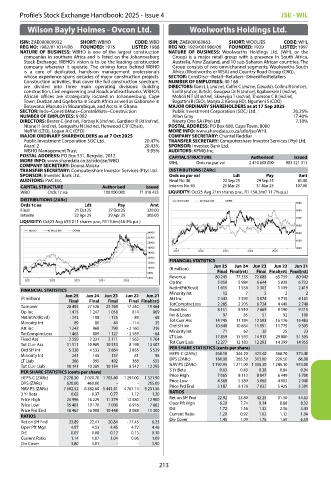
DISTRIBUTIONS [ZARc] WOOLIES 40 Week MA GERE
Ords 1c ea Ldt Pay Amt 9000
Final 21 Oct 25 27 Oct 25 320.00 8000
Interim 22 Apr 25 29 Apr 25 300.00
7000
LIQUIDITY: Oct25 Avg 659 011 shares p.w., R119.6m(48.3% p.a.)
6000
WBHO 40 Week MA CONM
24000 5000
22000
4000
20000
18000 3000
2021 2022 2023 2024 2025
16000
14000
12000 FINANCIAL STATISTICS
10000 (R million) Jun 25 Jun 24 Jun 23 Jun 22 Jun 21
8000 Final Final(rst) Final Final(rst) Final(rst)
6000 Revenue 80 243 77 335 72 688 65 739 80 942
2021 2022 2023 2024 2025 Op Inc 5 050 5 984 6 644 5 838 6 732
NetIntPd(Rcvd) 1 615 1 558 1 303 1 109 2 419
FINANCIAL STATISTICS
Jun 25 Jun 24 Jun 23 Jun 22 Jun 21 Minority Int 12 7 5 2 2
(R million) Att Inc 2 443 2 593 5 074 3 715 4 161
Final Final Final Final Final(rst)
Turnover 28 493 27 526 23 769 17 240 19 464 TotCompIncLoss 2 285 2 205 6 724 4 448 2 748
Op Inc 1 415 1 247 1 058 814 869 Fixed Ass 8 151 8 910 7 669 9 190 9 315
51
92
100
Inv & Loans
97
85
NetIntPd(Rcvd) - 243 - 198 - 125 - 89 - 68 Tot Curr Ass 14 745 11 184 12 593 16 126 15 483
Minority Int 89 80 44 - 114 35
Att Inc 1 242 968 790 - 2 160 316 Ord SH Int 10 640 10 864 11 991 11 775 9 305
71
25
30
23
62
TotCompIncLoss 1 463 889 1 127 - 2 589 - 64 Minority Int 17 859 15 593 14 913 29 880 31 305
LT Liab
Fixed Ass 2 559 2 331 2 111 1 563 1 764
Tot Curr Ass 11 511 10 989 10 553 8 198 13 407 Tot Curr Liab 12 277 12 183 12 293 14 399 14 955
Ord SH Int 5 328 4 533 3 864 2 855 5 529 PER SHARE STATISTICS (cents per share)
Minority Int 241 145 137 81 96 HEPS-C (ZARc) 268.10 364.20 423.40 368.70 374.40
LT Liab 366 395 492 388 555 DPS (ZARc) 188.00 265.50 313.00 229.50 66.00
Tot Curr Liab 10 141 10 289 10 154 8 542 12 295 NAV PS (ZARc) 1 192.95 1 211.00 1 338.30 1 245.10 973.00
PER SHARE STATISTICS (cents per share) 3 Yr Beta 0.63 0.43 0.38 0.84 0.94
HEPS-C (ZARc) 2 278.30 2 020.70 1 703.40 1 297.00 1 321.90 Price High 7 065 8 113 8 047 6 449 5 700
DPS (ZARc) 620.00 460.00 - - 205.00 Price Low 4 568 5 330 5 060 4 903 2 940
6 178
5 425
7 037
5 187
Price Prd End
5 391
NAV PS (ZARc) 7 502.52 6 382.60 5 441.41 4 767.14 9 231.56 RATIOS
3 Yr Beta 0.62 0.37 0.77 1.12 1.20
Price High 24 996 16 229 11 379 12 580 12 900 Ret on SH Fnd 22.92 23.80 42.25 31.50 44.63
Price Low 15 481 10 170 7 000 6 916 7 662 Oper Pft Mgn 6.29 7.74 9.14 8.88 8.32
Price Prd End 18 467 16 008 10 448 8 088 11 300 D:E 1.72 1.56 1.32 2.56 3.43
RATIOS Current Ratio 1.20 0.92 1.02 1.12 1.04
6.59
1.69
1.45
Div Cover
1.76
1.09
Ret on SH Fnd 23.89 22.41 20.84 - 77.45 6.23
Oper Pft Mgn 4.97 4.53 4.45 4.72 4.46
D:E 0.07 0.08 0.12 0.13 0.10
Current Ratio 1.14 1.07 1.04 0.96 1.09
Div Cover 3.80 4.01 - - 2.90
213