
Page 204 - Profile's Stock Exchange Handbook - 2025 Issue 4
P. 204
JSE - SUP Profile’s Stock Exchange Handbook: 2025 - Issue 4
Supermarket Income REIT plc Sygnia Ltd.
ISIN: GB00BF345X11 SHORT: SUPR CODE: SRI ISIN: ZAE000208815 SHORT: SYGNIA CODE: SYG
REG NO: 24/10799126 FOUNDED: 2017 LISTED: 2024 REG NO: 2007/025416/06 FOUNDED: 2015 LISTED: 2015
NATURE OF BUSINESS: Supermarket Income REIT plc (SUPR) is a NATURE OF BUSINESS: Sygnia is a financial services group based
United Kingdom-based Real Estate Investment Trust (REIT) and a in South Africa and the United Kingdom and is listed on the
leading investor in omnichannel supermarket properties across Johannesburg Stock Exchange and the A2X exchange. The Group
the United Kingdom (UK) and France. SUPR invests in supermarket focuses on the provision of investment management solutions and
properties forming a key part of the future model of grocery. administration services to institutional and retail clients located
SUPR’s core UK grocery market has grown by 35% since SUPR listed predominantly in South Africa.
on the LSE, from GBP185 billion in 2017 to GBP252 billion in 2024. SECTOR: Fins--FinServcs--InvBnkng&BrokerServcs--AssMgrs&Custodians
SECTOR: RealEstate--RealEstate--REITS--Retail NUMBER OF EMPLOYEES: 337
NUMBER OF EMPLOYEES: 0 DIRECTORS: Boyd J (ind ne), Cavaleros G (ld ind ne), Corelli J, Jakoet A
DIRECTORS: Austen J, Blundell R (ne), Davies F, Prior V, Shah S (ne), (ind ne), Bhorat H I (Chair, ne), Wierzycka M F (CEO), Ismail R (CFO)
Vanderspar C, Hewson N (Chair, ind ne), Abraham R (CEO), MAJOR ORDINARY SHAREHOLDERS as at 30 Sep 2024
Perkins M (CFO) Sapayoa Investments (Pty) Ltd. 29.98%
MAJOR ORDINARY SHAREHOLDERS as at 26 Mar 2025 SJB Peile 29.26%
Schroders plc 5.08% Clifford Street Holdings Ltd. 6.90%
BlackRock Inc. 5.00% POSTAL ADDRESS: PO Box 51591, Waterfront, 8002
Ameriprise Financial Inc. 4.70% MORE INFO: www.sharedata.co.za/sdo/jse/SYG
POSTAL ADDRESS: The Scalpel, 18th Floor, 52 Lime Street, London, COMPANY SECRETARY: Robyn Holwill
United Kingdom, EC3M 7AF TRANSFER SECRETARY: Computershare Investor Services (Pty) Ltd.
MORE INFO: www.sharedata.co.za/sdo/jse/SRI SPONSOR: Standard Bank of South Africa Ltd.
COMPANY SECRETARY: Hanway Advisory Ltd. AUDITORS: Forvis Mazars
TRANSFER SECRETARY: Computershare Investor Services (Pty) Ltd. CAPITAL STRUCTURE Authorised Issued
SPONSOR: PSG Capital (Pty) Ltd. SYG Ords no par val 500 000 000 156 043 196
AUDITORS: BDO LLP
CAPITAL STRUCTURE Authorised Issued DISTRIBUTIONS [ZARc]
Pay
Ldt
Amt
SRI Ords of GBP1p ea - 1 246 239 185 Ords no par val 24 Jun 25 30 Jun 25 98.00
Interim No 20
DISTRIBUTIONS [GBPp] Final No 19 20 Dec 24 30 Dec 24 127.00
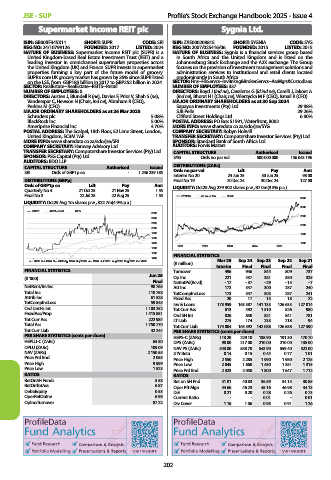
Ords of GBP1p ea Ldt Pay Amt LIQUIDITY: Oct25 Avg 279 302 shares p.w., R7.0m(9.3% p.a.)
Quarterly No 4 21 Oct 25 21 Nov 25 1.55
Final No 3 22 Jul 25 22 Aug 25 1.53 SYGNIA 40 Week MA GENF
3500
LIQUIDITY: Oct25 Avg 1m shares p.w., R22.7m(4.9% p.a.)
3000
SUPR 40 Week MA REIV
2300
2500
2200
2100
2000
2000
1900 1500
1800
1700 1000
2021 2022 2023 2024 2025
1600
1500 FINANCIAL STATISTICS
1400
Jan 2025 Feb 2025 Mar 2025 Apr 2025 May 2025 Jun 2025 Jul 2025 Aug 2025 Sep 2025 Oct 2025 Mar 25 Sep 24 Sep 23 Sep 22 Sep 21
(R million) Interim Final Final Final Final
FINANCIAL STATISTICS Turnover 496 946 844 809 737
Jun 25 Op Inc 221 437 381 380 325
(R ‘000) Final NetIntPd(Rcvd) - 17 - 37 - 29 - 15 - 7
NetRent/InvInc 98 765 Att Inc 172 347 300 287 240
Total Inc 118 758 TotCompIncLoss 173 347 303 287 241
Attrib Inc 61 528 Fixed Ass 20 17 15 18 22
TotCompIncLoss 59 845 Inv & Loans 173 959 163 387 141 133 126 633 127 014
Ord UntHs Int 1 103 252 Tot Curr Ass 613 492 1 510 526 980
FixedAss/Prop 1 415 851 Ord SH Int 826 850 821 841 781
Tot Curr Ass 222 984 LT Liab 275 174 233 218 94
Total Ass 1 750 770 Tot Curr Liab 174 004 163 392 142 088 126 558 127 590
Tot Curr Liab 42 244 PER SHARE STATISTICS (cents per share)
PER SHARE STATISTICS (cents per share) HEPS-C (ZARc) 113.20 229.10 198.90 191.30 170.70
HEPLU-C (ZARc) 65.80 DPS (ZARc) 98.00 217.00 210.00 210.00 135.00
DPLU (ZARc) 109.09 NAV PS (ZARc) 543.00 558.70 543.90 559.40 522.00
NAV (ZARc) 2 150.55 3 Yr Beta 0.14 0.15 0.44 0.77 1.01
Price Prd End 2 055 Price High 2 550 2 285 1 990 1 950 2 125
Price High 9 999 Price Low 2 045 1 660 1 450 1 351 1 315
Price Low 1 523 Price Prd End 2 323 2 050 1 800 1 647 1 712
RATIOS RATIOS
RetOnSH Funds 5.58 Ret on SH Fnd 41.81 40.83 36.59 34.15 30.85
RetOnTotAss 6.87 Oper Pft Mgn 44.66 46.23 45.16 46.98 44.13
Debt:Equity 0.55 D:E 0.21 0.20 0.28 0.26 0.73
OperRetOnInv 6.98 Current Ratio - - 0.01 - 0.01
OpInc:Turnover 87.22 Div Cover 1.16 1.06 0.95 0.91 1.26
202