
Page 166 - Profile's Stock Exchange Handbook - 2025 Issue 4
P. 166
JSE - OUT Profile’s Stock Exchange Handbook: 2025 - Issue 4
OUTsurance Group Ltd. Pan African Resources plc
ISIN: ZAE000314084 SHORT: OUTSURE CODE: OUT ISIN: GB0004300496 SHORT: PAN-AF CODE: PAN
REG NO: 2010/005770/06 FOUNDED: 2011 LISTED: 2011 REG NO: 3937466 FOUNDED: 2000 LISTED: 2007
NATURE OF BUSINESS: The OUTsurance Group is a multinational NATURE OF BUSINESS: Pan African is an internationally expanding
insurance group that specialises in Property and Casualty insurance. mid-tier gold producer. Our shares trade on the following markets:•
OUTsurance was founded in 1998 by three entrepreneurs and In South Africa through a primary listing on the Main Board of the
backed by the RMB Holdings Group. The Group’s activities are JSE (ticker: PAN) and a secondary listing on the A2X Market (A2X)•
focused on the South African and Australian insurance markets In the UK on the AIM of the LSE (ticker: PAF), with the intention
with the recent expansion into the Republic of Ireland. to migrate to the Equity Shares Commercial Companies (ESCC)
SECTOR: Fins--Insurance--Non-life Insurance--Full Line Insurance segment of the Main Market• In the United States of America (USA)
NUMBER OF EMPLOYEES: 7 049 on the OTCQX Best Market (OTCQX) through a Level 1 American
DIRECTORS: Kekana A (ne), Knoetze F (alt), Lucht U (alt), Depository Receipt (ADR) programme sponsored by the Bank of
Mahlare M M (ind ne), Moabi T (ind ne), Naidoo S (ind ne), New York Mellon (ticker: PAFRY) and ordinary shares (ticker: PAFRF).
Ndlovu R (ind ne), Pillay K (ld ind ne), Roos W T (ind ne), SECTOR: Basic Materials--Basic Resrcs--Precious Met & Min--Gold Min
Teeger J (ind ne), van Heerden H (ind ne), Visser M (CEO), NUMBER OF EMPLOYEES: 2 494
Hofmeyr J (FD), Bosman H L (Chair, ne), Durand J J (ne) DIRECTORS: Earp D (ld ind ne), Mosololi T F (ind ne), Needham C D S
MAJOR ORDINARY SHAREHOLDERS as at 30 Jun 2025 (ind ne), Themba Y (ind ne), Spencer K C (Chair, ind ne), Loots C (CEO),
Remgro 30.30% Kok M (FD)
Royal Bafokeng Holdings (Pty) Ltd. 14.10% MAJOR ORDINARY SHAREHOLDERS as at 1 Oct 2025
Public Investment Corporation (SOC) Ltd. 11.00% Allan Gray Investment Management 19.63%
POSTAL ADDRESS: PO Box 8443, Centurion, 0046 PAR Gold (Pty) Ltd. 13.78%
MORE INFO: www.sharedata.co.za/sdo/jse/OUT Public Investment Corporation (SOC) Ltd. 13.40%
COMPANY SECRETARY: J S Human POSTAL ADDRESS: PO Box 2768, Pinegowrie, 2123
TRANSFER SECRETARY: Computershare Investor Services (Pty) Ltd. MORE INFO: www.sharedata.co.za/sdo/jse/PAN
SPONSOR: Rand Merchant Bank (A division of FirstRand Bank Ltd.) COMPANY SECRETARY: St James’s Corporate Services (Jane Kirton)
AUDITORS: KPMG TRANSFER SECRETARY: Computershare Investor Services (Pty) Ltd.
CAPITAL STRUCTURE Authorised Issued SPONSOR: Questco (Pty) Ltd.
OUT Ords 0.01c ea 2 000 000 000 1 547 231 505 AUDITORS: PwC LLP
Issued
DISTRIBUTIONS [ZARc] CAPITAL STRUCTURE Authorised - 2 333 671 528
Ords GBP1p ea
PAN
Ords 0.01c ea Ldt Pay Amt
Final No 29 14 Oct 25 20 Oct 25 149.00 DISTRIBUTIONS [GBPp]
Special No 5 14 Oct 25 20 Oct 25 33.10 Ords GBP1p ea Ldt Pay Amt
LIQUIDITY: Oct25 Avg 16m shares p.w., R1 111.8m(52.9% p.a.) Final No 15 25 Nov 25 9 Dec 25 1.52
Final No 14 26 Nov 24 10 Dec 24 0.96
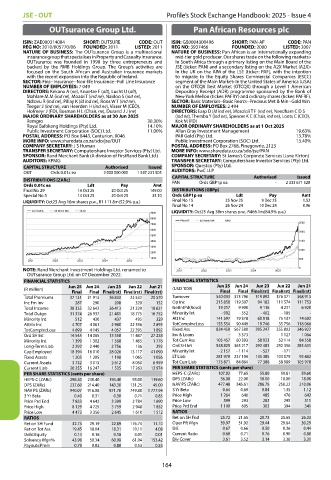
OUTSURE 40 Week MA GENF LIQUIDITY: Oct25 Avg 38m shares p.w., R466.1m(84.9% p.a.)
9000
8000
PAN-AF 40 Week MA MINI
7000 2500
6000
2000
5000
4000 1500
3000
1000
2000
1000 500
2021 2022 2023 2024 2025
NOTE: Rand Merchant Investment Holdings Ltd. renamed to 2021 2022 2023 2024 2025 0
OUTsurance Group Ltd. on 07 December 2022.
FINANCIAL STATISTICS FINANCIAL STATISTICS
Jun 25 Jun 24 Jun 23 Jun 22 Jun 21 Jun 25 Jun 24 Jun 23 Jun 22 Jun 21
(R million) (USD ’000)
Final Final Final(rst) Final(rst) Final(rst) Final Final Final(rst) Final(rst) Final(rst)
Total Premiums 37 131 31 913 26 833 23 532 20 570 Turnover 540 033 373 796 319 892 376 371 368 915
Inc Fm Inv 287 290 208 320 152 Op Inc 215 850 119 307 94 182 111 574 111 753
Total Income 38 335 32 642 26 413 21 329 18 621 NetIntPd(Rcvd) 19 217 9 900 9 116 4 231 6 920
Total Outgo 31 374 26 937 21 481 18 775 16 752 Minority Int - 992 - 552 - 402 - 185 -
Minority Int 512 430 437 495 329 Att Inc 141 597 79 378 60 918 75 137 74 692
Attrib Inc 4 707 4 061 2 980 22 396 2 893 TotCompIncLoss 155 554 90 449 19 746 35 756 118 066
TotCompIncLoss 4 699 4 145 4 057 22 395 1 892 Fixed Ass 824 450 567 588 395 247 355 802 346 922
Ord SH Int 14 545 14 085 13 358 11 487 27 238 Inv & Loans - 3 373 - 1 127 1 064
Minority Int 1 399 1 302 1 568 1 465 1 776 Tot Curr Ass 105 457 60 393 58 923 53 114 84 558
Long-Term Liab 2 292 2 440 2 756 136 292 Ord SH Int 548 825 365 217 292 483 292 356 283 631
Cap Employed 18 394 18 010 28 026 13 117 41 090 Minority Int - 2 157 - 1 114 - 527 - 171 -
Fixed Assets 1 205 1 205 1 198 1 065 1 056 LT Liab 281 970 237 104 135 385 103 079 93 482
Current Assets 3 732 3 015 2 612 8 050 6 959 Tot Curr Liab 175 871 84 864 77 386 58 989 105 978
Current Liab 20 255 16 247 1 535 17 263 12 974 PER SHARE STATISTICS (cents per share)
PER SHARE STATISTICS (cents per share) HEPS-C (ZARc) 107.02 77.65 55.80 59.81 59.60
HEPS-C (ZARc) 298.30 230.40 193.40 95.00 119.60 DPS (ZARc) 36.08 22.00 18.00 18.00 18.00
DPS (ZARc) 237.60 214.40 143.30 131.25 45.00 NAV PS (ZARc) 477.48 345.61 286.78 250.22 210.06
NAV PS (ZARc) 940.07 916.08 871.70 749.80 1 777.94 3 Yr Beta 0.64 0.69 0.84 1.35 1.12
3 Yr Beta 0.40 0.31 0.30 0.71 0.85 Price High 1 264 640 485 476 642
Price Prd End 7 833 4 642 3 399 2 784 1 690 Price Low 599 293 283 295 311
Price High 8 129 4 725 3 759 2 948 1 852 Price Prd End 1 109 605 303 394 341
Price Low 4 473 3 356 2 645 1 610 1 512 RATIOS
RATIOS Ret on SH Fnd 25.72 21.65 20.73 25.65 26.33
Ret on SH Fund 32.73 29.19 22.89 176.74 11.10 Oper Pft Mgn 39.97 31.92 29.44 29.64 30.29
Ret on Tot Ass 19.45 18.04 18.31 10.11 4.08 D:E 0.67 0.66 0.50 0.36 0.44
Debt:Equity 0.14 0.16 0.18 0.01 0.01 Current Ratio 0.60 0.71 0.76 0.90 0.80
Solvency Mgn% 43.98 50.34 60.08 61.04 153.42 Div Cover 3.61 3.52 3.14 3.30 3.31
Payouts:Prem 0.79 0.82 0.80 0.53 0.53
164