
Page 165 - Profile's Stock Exchange Handbook - 2025 Issue 1
P. 165
Profile’s Stock Exchange Handbook: 2025 – Issue 1 JSE – PAN
Pan African Resources plc PBT Group Ltd.
PAN PBT
ISIN: GB0004300496 SHORT: PAN-AF CODE: PAN ISIN: ZAE000256319 SHORT: PBT GROUP CODE: PBG
REG NO: 3937466 FOUNDED: 2000 LISTED: 2007 REG NO: 1936/008278/06 FOUNDED: 1981 LISTED: 2012
NATURE OF BUSINESS: Pan African is an African-focused mid-tier gold NATURE OF BUSINESS: PBT Group has a staff complement of 825, of
producer, dual primary listed on the AIM of the LSE (ticker: PAF) and the which the vast majority are highly skilled and professional consultants.
main board of the JSE (ticker: PAN) as well as the A2X Market (A2X). Our PBT Group has established strategic alliances with recognised local and
shares trade on the OTCQX Best Market (OTCQX) in the United States of international vendors. PBT Group’s consultants have a sincere
America (USA) through a Level 1 American Depository Receipt (ADR) commitment to providing the highest levels of service and the most
programme (ticker: PAFRY), sponsored by the Bank of New York Mellon, appropriate solutions to our clients.
and ordinary shares (ticker: PAFRF). SECTOR:Technology—Technology—Software&CompSer—ComputerService
SECTOR:BasicMaterials—BasicResrcs—PreciousMet&Min—GoldMin NUMBER OF EMPLOYEES: 825
NUMBER OF EMPLOYEES: 2 198 DIRECTORS: Dyers C L (ind ne), Taukobong P (ne), Winkler A L (ind ne),
DIRECTORS: Earp D (ld ind ne), Mosololi T F (ind ne), Needham C D Taylor T (Chair, ind ne), Read E (CEO), Pieters B (CFO)
S(ind ne), Themba Y (ind ne), Spencer K C (Chair, ind ne), Loots C MAJOR ORDINARY SHAREHOLDERS as at 28 Jun 2024
(CEO), Kok M (FD) Spalding Investments 10 (Pty) Ltd. 27.23%
MAJOR ORDINARY SHAREHOLDERS as at 27 Dec 2024 Pulsent PBT (Pty) Ltd. 22.60%
Allan Gray Investment Management 19.63% Banque Lombard Odier & CIE SA 16.03%
Allan Gray Balanced Fund 15.28% POSTAL ADDRESS: PO Box 276, Century City, 7446
PAR Gold (Pty) Ltd. 13.78% MORE INFO: www.sharedata.co.za/sdo/jse/PBG
POSTAL ADDRESS: PO Box 2768, Pinegowrie, 2123 COMPANY SECRETARY: Anastassia Sousa
MORE INFO: www.sharedata.co.za/sdo/jse/PAN TRANSFER SECRETARY: JSE Investor Services (Pty) Ltd.
COMPANY SECRETARY: St James’s Corporate Services SPONSOR: Questco Corporate Advisory (Pty) Ltd.
TRANSFER SECRETARY: Computershare Investor Services (Pty) Ltd. AUDITORS: BDO South Africa Inc.
SPONSOR: Questco (Pty) Ltd. CAPITAL STRUCTURE AUTHORISED ISSUED
AUDITORS: PwC LLP
PBG Ords no par value 200 000 000 106 330 773
CAPITAL STRUCTURE AUTHORISED ISSUED DISTRIBUTIONS [ZARc]
PAN Ords GBP1p ea - 2 335 675 263
Ords no par value Ldt Pay Amt Scr/100
DISTRIBUTIONS [GBPp] Interim No 24 17 Dec 24 23 Dec 24 27.00 5.03
Ords GBP1p ea Ldt Pay Amt Final No 23 16 Jul 24 22 Jul 24 17.00 -
Final No 14 26 Nov 24 10 Dec 24 0.96
Final No 13 28 Nov 23 12 Dec 23 0.76 LIQUIDITY: Jan25 Avg 69 483 shares p.w., R415 429.7(3.4% p.a.)
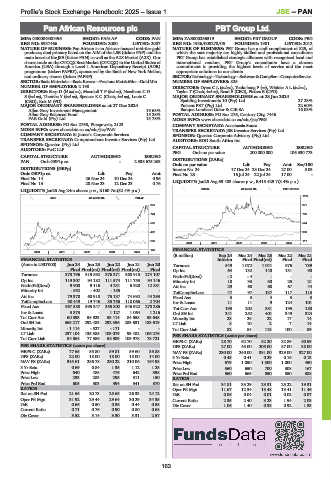
SCOM 40 Week MA PBT GROUP
LIQUIDITY: Jan25 Avg 24m shares p.w., R160.7m(52.4% p.a.)
1185
MINI 40 Week MA PAN-AF
870 971
724 758
578 544
432 330
286 117
2020 | 2021 | 2022 | 2023 | 2024 |
140 FINANCIAL STATISTICS
2020 | 2021 | 2022 | 2023 | 2024 |
(R million) Sep 24 Mar 24 Mar 23 Mar 22 Mar 21
FINANCIAL STATISTICS Interim Final Final(rst) Final Final
(Amts in USD’000) Jun 24 Jun 23 Jun 22 Jun 21 Jun 20 Turnover 549 1 072 1 041 976 789
Final Final(rst) Final(rst) Final(rst) Final Op Inc 64 132 140 131 90
Turnover 373 796 319 892 376 371 368 915 274 107 NetIntPd(Rcvd) - 2 - 4 - - -
Op Inc 119 307 94 182 111 574 111 753 94 146 Minority Int 18 33 30 25 21
NetIntPd(Rcvd) 9 900 9 116 4 231 6 920 12 881 Att Inc 29 60 68 67 44
Minority Int - 552 - 402 - 185 - - TotCompIncLoss 47 97 137 117 113
Att Inc 79 378 60 918 75 137 74 692 44 293 Fixed Ass 3 3 4 3 3
TotCompIncLoss 90 449 19 746 35 756 118 066 2 704 Inv & Loans 11 11 9 124 101
Fixed Ass 567 588 395 247 355 802 346 922 270 286 Tot Curr Ass 193 202 381 195 180
Inv & Loans 3 373 - 1 127 1 064 1 216 Ord SH Int 241 252 401 349 324
Tot Curr Ass 60 393 58 923 53 114 84 558 53 648 Minority Int 28 26 22 17 14
Ord SH Int 365 217 292 483 292 356 283 631 183 619 LT Liab 8 10 2 7 14
Minority Int - 1 114 - 527 - 171 - - Tot Curr Liab 82 84 118 100 89
LT Liab 237 104 135 385 103 079 93 482 106 276 PER SHARE STATISTICS (cents per share)
Tot Curr Liab 84 864 77 386 58 989 105 978 78 721
HEPS-C (ZARc) 28.70 62.70 82.20 82.89 50.59
PER SHARE STATISTICS (cents per share) DPS (ZARc) 27.00 43.00 205.00 87.00 38.00
HEPS-C (ZARc) 77.65 55.80 59.81 59.60 35.88 NAV PS (ZARc) 230.00 240.00 381.00 329.00 327.00
DPS (ZARc) 22.00 18.00 18.00 18.00 14.00 3 Yr Beta 0.48 0.41 0.29 0.16 0.13
NAV PS (ZARc) 345.61 286.78 250.22 210.06 164.98 Price High 679 1 050 1 300 1 000 450
3 Yr Beta 0.69 0.84 1.35 1.12 1.28 Price Low 560 650 700 308 167
Price High 640 485 476 642 398 Price Prd End 560 665 850 850 388
Price Low 293 283 295 311 150 RATIOS
Price Prd End 605 303 394 341 370 Ret on SH Fnd 34.81 33.29 23.31 25.22 19.31
RATIOS Oper Pft Mgn 11.67 12.34 13.48 13.41 11.46
Ret on SH Fnd 21.65 20.73 25.65 26.33 24.12 D:E 0.06 0.04 0.01 0.02 0.07
Oper Pft Mgn 31.92 29.44 29.64 30.29 34.35 Current Ratio 2.35 2.40 3.23 1.94 2.03
D:E 0.66 0.50 0.36 0.44 0.58 Div Cover 1.06 1.40 0.38 0.92 1.33
Current Ratio 0.71 0.76 0.90 0.80 0.68
Div Cover 3.52 3.14 3.30 3.31 2.57
163