
Page 128 - Profile's Stock Exchange Handbook - 2025 Issue 1
P. 128
JSE – HER Profile’s Stock Exchange Handbook: 2025 – Issue 1
Heriot REIT Ltd. Homechoice International plc
HER HOM
ISIN: ZAE000246740 SHORT: HERIOT CODE: HET ISIN: MT0000850108 SHORT: HOMCHOICE CODE: HIL
REG NO: 2017/167697/06 FOUNDED: 1998 LISTED: 2017 REG NO: C171926 FOUNDED: 2014 LISTED: 2014
NATURE OF BUSINESS: Heriot is a property holding and investment NATURE OF BUSINESS: HomeChoice International plc is a diversified
company that is listed in the “Diversified REITs” sector on the Alternative digital consumer services group incorporated in Mauritius and listed on
Exchange of the JSE. The Group is primarily invested in retail and the JSE Ltd. The group has developed considerable expertise in the
industrial properties situated in areas with high growth potential and has a provision of financial services and retail products targeted to the mass
strategic interest of 48.7% in Safari Investments RSA Ltd. (“Safari”). market who are increasingly adopting the use of mobile phones to engage
Heriot’s primary objective is to grow and streamline its asset base through with the group digitally.
the acquisition of high-quality properties, the redevelopment of existing SECTOR: ConsDiscr—Retail—Retailers—DiversifiedRetailers
properties and the disposal of assets identified as non-core. NUMBER OF EMPLOYEES: 1 761
SECTOR: AltX DIRECTORS: Gutierrez-Garcia E (ne), Harris M (ind ne), Joubert P
NUMBER OF EMPLOYEES: 0 G(ld ind ne), Ogunsanya A (alt), Phillips R (ind ne), Maltz S (Chair),
DIRECTORS: HeronGJ(ne), Lockhart-Ross R (ind ne), Mazwai A (ne), Wibberley S (CEO), Burnett P (FD)
Herring R L (CEO), Snoyman D (CFO), Herring S (Chair, ne, UK), MAJOR ORDINARY SHAREHOLDERS as at 31 Dec 2023
BliedenSJ(ld ind ne) GFM 70.20%
MAJOR ORDINARY SHAREHOLDERS as at 30 Jun 2024 ADP II Holdings 3 Ltd. 21.60%
S Herring 89.07% POSTAL ADDRESS: Private Bag X123, Claremont, 7735
R Herring 4.60% MORE INFO: www.sharedata.co.za/sdo/jse/HIL
POSTAL ADDRESS: PO Box 652737, Benmore, 2010 COMPANY SECRETARY: Sanlam Trustees International (Mauritius)
MORE INFO: www.sharedata.co.za/sdo/jse/HET TRANSFER SECRETARY: Computershare Investor Services (Pty) Ltd.
COMPANY SECRETARY: CIS Company Secretaries (Pty) Ltd. SPONSOR: Rand Merchant Bank (A division of FirstRand Bank Ltd.)
TRANSFER SECRETARY: Computershare Investor Services (Pty) Ltd. AUDITORS: PricewaterhouseCoopers (Mauritius)
DESIGNATED ADVISOR: Valeo Capital (Pty) Ltd.
AUDITORS: BDO South Africa Inc. CAPITAL STRUCTURE AUTHORISED ISSUED
HIL Ords 0.01c ea 200 000 000 106 730 376
CAPITAL STRUCTURE AUTHORISED ISSUED
HET Ords no par val 2 000 000 000 320 161 982 DISTRIBUTIONS [ZARc]
Ords 0.01c ea Ldt Pay Amt
DISTRIBUTIONS [ZARc] Interim No 17 3 Sep 24 9 Sep 24 95.00
Ords no par val Ldt Pay Amt Final No 16 9 Apr 24 15 Apr 24 83.00
Final No 14 15 Oct 24 21 Oct 24 56.81 LIQUIDITY: Jan25 Avg 8 964 shares p.w., R229 147.6(0.4% p.a.)
Interim No 13 16 Apr 24 22 Apr 24 49.87
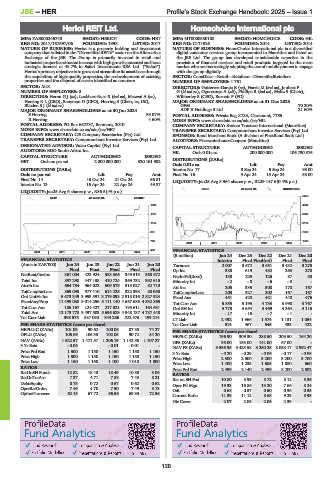
GERE 40 Week MA HOMCHOICE
LIQUIDITY: Jan25 Avg 6 shares p.w., R86.5(-% p.a.)
5255
REIV 40 Week MA HERIOT
1600 4544
1377 3834
1154 3124
931 2413
708 1703
2020 | 2021 | 2022 | 2023 | 2024 |
486 FINANCIAL STATISTICS
2020 | 2021 | 2022 | 2023 | 2024 |
(R million) Jun 24 Dec 23 Dec 22 Dec 21 Dec 20
FINANCIAL STATISTICS Interim Final Final(rst) Final Final
(Amts in ZAR’000) Jun 24 Jun 23 Jun 22 Jun 21 Jun 20 Turnover 2 007 3 672 3 651 3 432 3 275
Final Final Final Final Final Op Inc 388 619 482 263 270
NetRent/InvInc 861 004 423 924 383 366 349 519 368 672 NetIntPd(Rcvd) 138 225 126 87 88
Total Inc 897 298 447 138 410 724 369 732 392 615 Minority Int - 2 - 8 - 6 - 3 -
Attrib Inc 664 734 964 022 609 579 313 027 82 710 Att Inc 205 335 308 170 167
TotCompIncLoss 869 093 977 410 614 225 322 398 88 058 TotCompIncLoss 203 327 302 167 167
Ord UntHs Int 5 673 349 3 953 591 3 279 093 2 918 016 2 827 924 Fixed Ass 451 428 421 448 476
FixedAss/Prop 11 493 038 9 014 296 5 111 140 4 667 686 4 532 865 Tot Curr Ass 5 855 5 195 4 733 3 998 3 767
Tot Curr Ass 185 167 124 427 217 821 195 611 164 631 Ord SH Int 3 775 3 654 3 469 3 264 3 116
Total Ass 12 173 778 9 497 503 5 696 629 4 948 137 4 787 448 Minority Int - 17 - 15 - 7 - 1 -
Tot Curr Liab 398 575 887 090 344 236 522 575 199 214 LT Liab 2 492 1 966 1 574 1 131 1 054
PER SHARE STATISTICS (cents per share) Tot Curr Liab 514 467 545 433 422
HEPLU-C (ZARc) 101.03 90.62 100.06 87.35 74.27 PER SHARE STATISTICS (cents per share)
DPLU (ZARc) 106.69 106.33 102.05 90.72 84.20 HEPS-C (ZARc) 196.90 309.30 288.50 203.50 164.20
NAV (ZARc) 1 522.57 1 471.57 1 206.19 1 142.55 1 107.27 DPS (ZARc) 95.00 153.00 141.00 67.00 -
3 Yr Beta - 0.05 - - 0.01 - 0.01 - NAV PS (ZARc) 3 536.95 3 423.58 3 250.25 3 058.17 2 992.47
Price Prd End 1 500 1 150 1 150 1 150 1 150 3 Yr Beta - 0.20 - 0.29 - 0.06 - 0.17 - 0.08
Price High 1 500 1 150 1 150 1 150 1 150 Price High 2 500 2 500 3 200 3 200 3 700
Price Low 1 150 1 150 1 100 1 010 1 000 Price Low 1 400 1 235 1 685 1 880 660
RATIOS Price Prd End 2 499 2 140 2 499 3 200 2 502
RetOnSH Funds 12.82 18.43 18.49 10.88 3.06 RATIOS
RetOnTotAss 7.37 4.71 7.89 7.43 8.21 Ret on SH Fnd 10.80 8.99 8.72 5.12 5.36
Debt:Equity 0.75 0.72 0.67 0.62 0.62 Oper Pft Mgn 19.33 16.86 13.20 7.66 8.24
OperRetOnInv 7.49 4.70 7.50 7.49 8.13 D:E 0.68 0.57 0.50 0.36 0.35
OpInc:Turnover 62.15 67.72 66.56 69.33 72.56 Current Ratio 11.39 11.12 8.68 9.23 8.93
Div Cover 2.07 2.05 2.05 2.39 -
126