
Page 161 - shbh24_complete
P. 161
Profile’s Stock Exchange Handbook: 2024 – Issue 3 JSE – ORI
Orion Minerals Ltd. OUTsurance Group Ltd.
ORI OUT
ISIN: AU000000ORN1 SHORT: ORIONMIN CODE: ORN ISIN: ZAE000314084 SHORT: OUTSURE CODE: OUT
REG NO: 098 939 274 FOUNDED: 2001 LISTED: 2017 REG NO: 2010/005770/06 FOUNDED: 2011 LISTED: 2011
NATURE OF BUSINESS: Orion Minerals Ltd. (Orion or Company) is a NATURE OF BUSINESS: OUTsure is a JSE-listed holding company with
company limited by shares that is incorporated and domiciled in Australia. significant investments in property and casualty insurance (P&C), life
The Company has prepared a consolidated financial report incorporating insurance, asset management and fintech in South Africa, the United
the entities that it controlled during the financial year, including those Kingdom and Australia. Since its formation, and in partnership with the
newly acquired (referred to as the Group). Rand Merchant Bank group of companies, OUTsure has been the most
The principal activity of the Group during the year was exploration, significant investor in some of South Africa’s most iconic financial services
evaluation and development of base metal, gold and platinum-group brands, as well as a portfolio of emerging financial services businesses.
element projects in South Africa (Areachap Belt and Okiep Copper SECTOR: Fins—Insurance—Non-life Insurance—Full Line Insurance
Complex, Northern Cape). The Company also holds interests in the Fraser NUMBER OF EMPLOYEES: 12
Range Nickel-Copper and Gold Project in Western Australia and the DIRECTORS: Hanise B (ind ne), Kekana A (ne), Knoetze F (alt),
Walhalla Project in Victoria, Australia. There were no significant changes Lucht U (alt), MahlareMM(ind ne), Marx G L (ind ne),
in the nature of the Group’s principal activities during the year. Moabi T (ind ne), Naidoo S (ind ne), Ndlovu R (ind ne), Pillay K (ld ind ne),
SECTOR:BasicMaterials—BasicResrcs—IndMet&Min—GeneralMining Roos W T (ind ne), Teeger J (ind ne), van Heerden H (ind ne),
NUMBER OF EMPLOYEES: 0 Visser M (CEO), Hofmeyr J (FD), Bosman H L (Chair, ne), Durand JJ(ne),
DIRECTORS: Gomwe G (ne, Zim), LennoxMrAW(ne), Mpofu Dr P (ne), Morobe M M (ind ne)
PalmerM(ne, Aus), Waddell D (Chair, ne), Smart E (MD) MAJOR ORDINARY SHAREHOLDERS as at 25 Apr 2024
MAJOR ORDINARY SHAREHOLDERS as at 13 May 2024 Remgro 30.60%
Ndovu Capital x BV (Tembo) 19.02% Royal Bafokeng Holdings (Pty) Ltd. 14.20%
Sparta AG 12.62% Public Investment Corporation 10.00%
Clover Alloys Copper Investments (Pty) Ltd. 7.88% POSTAL ADDRESS: PO Box 8443, Centurion, 0046
POSTAL ADDRESS: PO Box 260, Collins Street West, Victoria, 8007 MORE INFO: www.sharedata.co.za/sdo/jse/OUT
MORE INFO: www.sharedata.co.za/sdo/jse/ORN COMPANY SECRETARY: J S Human
COMPANY SECRETARY: Martin Bouwmeester TRANSFER SECRETARY: Computershare Investor Services (Pty) Ltd.
TRANSFER SECRETARY: JSE Investor Services (Pty) Ltd. SPONSOR: Rand Merchant Bank (A division of FirstRand Bank Ltd.)
SPONSOR: Merchantec Capital AUDITORS: KPMG
AUDITORS: Mazars Melbourne Assurance (Pty) Ltd.
CAPITAL STRUCTURE AUTHORISED ISSUED
CAPITAL STRUCTURE AUTHORISED ISSUED OUT Ords 0.01c ea 2 000 000 000 1 537 535 862
ORN Ords no par value - 6 055 638 292
DISTRIBUTIONS [ZARc]
LIQUIDITY: Jul24 Avg 14m shares p.w., R2.9m(12.2% p.a.) Ords 0.01c ea Ldt Pay Amt
Interim No 26 9 Apr 24 15 Apr 24 61.20
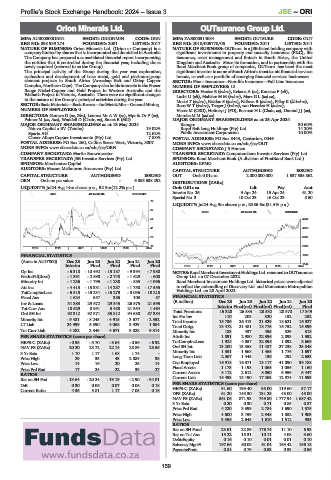
MINI 40 Week MA ORIONMIN
Special No 3 10 Oct 23 16 Oct 23 8.50
79
LIQUIDITY: Jul24 Avg 9m shares p.w., R386.6m(31.5% p.a.)
67
GENF 40 Week MA OUTSURE
54 4749
41 4028
29 3307
16 2586
2019 | 2020 | 2021 | 2022 | 2023 | 2024
FINANCIAL STATISTICS 1865
(Amts in AUD’000) Dec 23 Jun 23 Jun 22 Jun 21 Jun 20
Interim Final Final Final Final 2019 | 2020 | 2021 | 2022 | 2023 | 2024 1144
Op Inc - 6 318 - 10 492 - 15 187 - 9 394 - 7 980 NOTES: Rand Merchant Investment Holdings Ltd. renamed to OUTsurance
NetIntPd(Rcvd) - 1 391 - 2 890 - 2 748 - 1 629 - 600 Group Ltd. on 07 December 2022.
Minority Int - 1 236 - 1 795 - 1 238 - 885 - 1 096 Rand Merchant Investment Holdings Ltd. historical prices were adjusted
Att Inc - 4 413 - 15 331 - 14 287 - 1 758 - 17 555 to reflect the unbundling of Discovery Ltd. and Momentum Metropolitan
TotCompIncLoss - 5 513 - 15 231 - 15 279 - 3 036 - 18 218 Holdings Ltd. on 20 April 2022.
Fixed Ass 1 624 557 386 103 57 FINANCIAL STATISTICS
Inv & Loans 31 383 29 672 29 345 26 875 21 595 (R million) Dec 23 Jun 23 Jun 22 Jun 21 Jun 20
Tot Curr Ass 18 629 8 951 5 458 21 354 1 464 Interim Final(rst) Final(rst) Final(rst) Final
Ord SH Int 92 312 92 871 85 812 94 680 57 384 Total Premiums 15 328 26 833 23 532 20 570 17 349
Inc Fm Inv
320
152
252
208
110
Minority Int - 9 481 - 8 245 - 4 915 - 3 677 - 2 552
Total Income 15 736 26 413 21 329 18 621 16 927
LT Liab 24 999 5 390 4 068 3 929 1 684 Total Outgo 13 472 21 481 18 775 16 752 15 399
Tot Curr Liab 4 282 2 349 4 671 3 028 9 314 Minority Int 183 437 495 329 318
PER SHARE STATISTICS (cents per share) Attrib Inc 1 891 2 980 22 396 2 893 1 592
HEPS-C (ZARc) - 0.98 - 3.70 - 3.64 - 0.56 - 6.92 TotCompIncLoss 1 924 4 057 22 395 1 892 3 669
NAV PS (ZARc) 20.20 23.72 22.14 28.89 25.56 Ord SH Int 13 200 13 358 11 487 27 238 25 848
3 Yr Beta 1.10 1.17 1.68 1.74 - Minority Int 1 351 1 568 1 465 1 776 1 697
Price High 29 33 43 2 889 38 Long-Term Liab 2 367 1 445 136 292 2 653
Price Low 14 16 20 25 14 Cap Employed 16 918 16 371 13 117 41 090 39 788
Price Prd End 17 24 22 39 27 Fixed Assets 1 173 1 198 1 065 1 056 1 160
RATIOS Current Assets 3 112 2 612 8 050 6 959 6 447
Ret on SH Fnd - 13.64 - 20.24 - 19.19 - 2.90 - 34.01 Current Liab 15 493 13 190 17 263 12 974 11 593
D:E 0.30 0.06 0.07 0.06 0.18 PER SHARE STATISTICS (cents per share)
Current Ratio 4.35 3.81 1.17 7.05 0.16 HEPS-C (ZARc) 91.60 193.40 95.00 119.60 37.17
DPS (ZARc) 61.20 143.30 131.25 45.00 45.00
NAV PS (ZARc) 861.06 871.93 749.80 1 777.94 1 687.42
3 Yr Beta 0.20 0.30 0.71 0.85 0.87
Price Prd End 4 220 3 399 2 784 1 690 1 575
Price High 4 600 3 759 2 948 1 852 1 903
Price Low 3 356 2 645 1 610 1 512 935
RATIOS
Ret on SH Fund 28.51 22.89 176.74 11.10 6.93
Ret on Tot Ass 15.22 18.31 10.11 4.08 3.60
Debt:Equity 0.16 0.10 0.01 0.01 0.10
Solvency Mgn% 197.66 60.08 61.04 153.42 166.18
Payouts:Prem 0.84 0.79 0.53 0.53 0.56
159