
Page 194 - Profile's Stock Exchange Handbook - 2026 Issue 2
P. 194
JSE - TIG Profile’s Stock Exchange Handbook: 2026 - Issue 2
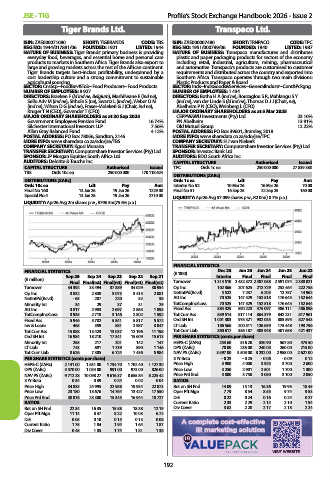
Tiger Brands Ltd. Transpaco Ltd.
ISIN: ZAE000071080 SHORT: TIGBRANDS CODE: TBS ISIN: ZAE000007480 SHORT: TRNPACO CODE: TPC
REG NO: 1944/017881/06 FOUNDED: 1921 LISTED: 1944 REG NO: 1951/000799/06 FOUNDED: 1940 LISTED: 1987
NATURE OF BUSINESS: Tiger Brands’ primary business is providing NATURE OF BUSINESS: Transpaco manufactures and distributes
everyday food, beverages, and essential home and personal care plastic and paper packaging products for sectors of the economy
products to markets in Southern Africa. Tiger Brands also export to including retail, industrial, agriculture, mining, pharmaceutical
large and growing markets across the rest of the African continent. and automotive. Transpaco’s products are customised to customer
Tiger Brands targets best-inclass profitability, underpinned by a requirements and distributed across the country and exported into
cost leadership culture and a strong commitment to sustainable Southern Africa. Transpaco operates through two main divisions:
agricultural sourcing. Plastic Products and Paper & Board.
SECTOR: CnsStp--FoodBev&Tob--Food Producers--Food Products SECTOR: Inds--IndsGoods&Services--GeneralIndustr--Cont&Pckgng
NUMBER OF EMPLOYEES: 9 927 NUMBER OF EMPLOYEES: 1 434
DIRECTORS: Braeken F (ld ind ne, Belgium), Mashilwane E (ind ne), DIRECTORS: Botha H A (ind ne), Bouzaglou S R, Mahlangu S Y
Sello Adv M (ind ne), Sithole S (ne), Swartz L (ind ne), Weber O M (ind ne), van der Linde S (ld ind ne), Thomas D J J (Chair, ne),
(ind ne), Wilson D G (ind ne), Fraser-Moleketi G J (Chair, ind ne), Abelheim P N (CEO), Weinberg L (CFO)
Kruger T N (CEO), Govender T (CFO) MAJOR ORDINARY SHAREHOLDERS as at 5 Mar 2025
MAJOR ORDINARY SHAREHOLDERS as at 30 Sep 2025 CEPPWAWU Investments (Pty) Ltd. 23.10%
Government Employees Pension Fund 16.74% PN Abelheim 13.91%
Silchester International Investors LLP 7.56% Old Mutual Group 12.22%
Allan Gray Balanced Fund 4.12% POSTAL ADDRESS: PO Box 39601, Bramley, 2018
POSTAL ADDRESS: PO Box 78056, Sandton, 2146 MORE INFO: www.sharedata.co.za/sdo/jse/TPC
MORE INFO: www.sharedata.co.za/sdo/jse/TBS COMPANY SECRETARY: H J van Niekerk
COMPANY SECRETARY: Kgosi Monaisa TRANSFER SECRETARY: Computershare Investor Services (Pty) Ltd.
TRANSFER SECRETARY: Computershare Investor Services (Pty) Ltd. SPONSOR: Investec Bank Ltd.
SPONSOR: JP Morgan Equities South Africa Ltd. AUDITORS: BDO South Africa Inc.
AUDITORS: Deloitte & Touche Inc. CAPITAL STRUCTURE Authorised Issued
CAPITAL STRUCTURE Authorised Issued TPC Ords 1c ea 250 000 000 27 839 388
TBS Ords 10c ea 250 000 000 170 118 624 DISTRIBUTIONS [ZARc]
DISTRIBUTIONS [ZARc] Ords 1c ea Ldt Pay Amt
Ords 10c ea Ldt Pay Amt Interim No 52 10 Mar 26 16 Mar 26 70.00
Final No 160 13 Jan 26 19 Jan 26 1229.00 Final No 51 16 Sep 25 22 Sep 25 160.00
Special No 4 13 Jan 26 19 Jan 26 2710.00 LIQUIDITY: Apr26 Avg 57 099 shares p.w., R2.0m(10.7% p.a.)
LIQUIDITY: Apr26 Avg 2m shares p.w., R796.3m(75.6% p.a.)
FINANCIAL STATISTICS
FINANCIAL STATISTICS (R ‘000) Dec 25 Jun 25 Jun 24 Jun 23 Jun 22
Sep 25 Sep 24 Sep 23 Sep 22 Sep 21 Interim Final Final Final Final
(R million)
Final Final(rst) Final(rst) Final(rst) Final(rst) Turnover 1 314 510 2 432 372 2 487 058 2 591 074 2 338 021
Turnover 34 392 33 494 37 389 34 029 30 954 Op Inc 102 366 207 625 212 729 252 464 222 758
Op Inc 3 832 2 838 3 075 3 415 2 081 NetIntPd(Rcvd) 5 522 7 237 6 203 12 757 14 962
NetIntPd(Rcvd) - 65 287 220 52 36 Att Inc 70 525 147 529 152 518 176 645 152 644
Minority Int 34 29 37 31 29 TotCompInc/Loss 70 525 147 529 152 518 176 645 152 644
Att Inc 3 817 2 983 2 697 2 865 1 893 Fixed Ass 584 325 590 223 475 097 486 111 486 898
TotCompInc/Loss 3 935 2 718 3 146 2 802 1 592 Tot Curr Ass 839 514 817 114 864 379 842 231 817 961
Fixed Ass 5 946 5 782 5 841 5 817 5 572 Ord SH Int 1 001 303 975 321 932 035 885 595 827 543
Inv & Loans 465 559 581 2 987 3 047 LT Liab 186 566 200 511 126 639 175 448 193 796
Tot Curr Ass 15 088 13 423 13 037 12 196 11 198 Tot Curr Liab 360 617 356 187 403 948 401 658 421 437
Ord SH Int 16 984 18 210 17 341 15 609 15 613 PER SHARE STATISTICS (cents per share)
Minority Int 255 217 201 142 147 HEPS-C (ZARc) 253.60 516.20 520.90 567.80 475.50
LT Liab 743 891 1 739 890 1 146 DPS (ZARc) 70.00 235.00 240.00 260.00 215.00
Tot Curr Liab 8 626 7 305 6 724 7 436 5 984 NAV PS (ZARc) 3 597.00 3 503.00 3 232.00 2 958.00 2 627.00
PER SHARE STATISTICS (cents per share) 3 Yr Beta - 0.23 - 0.25 - 0.06 - 0.09 0.12
HEPS-C (ZARc) 2 141.00 1 631.00 1 734.70 1 702.40 1 127.30 Price High 3 900 4 000 3 925 3 700 2 600
DPS (ZARc) 5 570.00 1 034.00 991.00 973.00 826.00 Price Low 3 250 2 901 2 501 1 700 1 300
NAV PS (ZARc) 9 712.28 10 098.27 9 616.37 8 655.84 8 225.42 Price Prd End 3 800 3 750 3 050 3 100 2 050
3 Yr Beta 0.34 0.39 0.24 0.02 0.04 RATIOS
Price High 34 833 24 995 22 958 19 934 22 873 Ret on SH Fnd 14.09 15.13 16.36 19.95 18.45
Price Low 23 180 13 676 14 754 13 427 17 550 Oper Pft Mgn 7.79 8.54 8.55 9.74 9.53
Price Prd End 30 876 23 300 15 345 16 944 18 727 D:E 0.22 0.24 0.16 0.24 0.27
RATIOS Current Ratio 2.33 2.29 2.14 2.10 1.94
Ret on SH Fnd 22.34 16.35 15.58 18.38 12.19 Div Cover 3.62 2.20 2.17 2.18 2.24
Oper Pft Mgn 11.14 8.47 8.22 10.03 6.72
D:E 0.05 0.10 0.15 0.13 0.08 A complete cost-e ective
t-e
os
e c
ectiv
A c
e
omplet
Current Ratio 1.75 1.84 1.94 1.64 1.87
IR marketing solution
Div Cover 0.45 1.85 1.74 1.81 1.38 IR mark eting solution
VISIT WEBSITE
192