
Page 192 - Profile's Stock Exchange Handbook - 2026 Issue 2
P. 192
JSE - TEL Profile’s Stock Exchange Handbook: 2026 - Issue 2
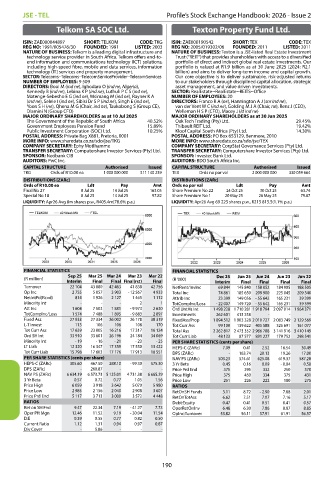
Telkom SA SOC Ltd. Texton Property Fund Ltd.
ISIN: ZAE000044897 SHORT: TELKOM CODE: TKG ISIN: ZAE000190542 SHORT: TEX CODE: TEX
REG NO: 1991/005476/30 FOUNDED: 1991 LISTED: 2003 REG NO: 2005/019302/06 FOUNDED: 2011 LISTED: 2011
NATURE OF BUSINESS: Telkom is a leading digital infrastructure and NATURE OF BUSINESS: Texton is a JSE-listed Real Estate Investment
technology service provider in South Africa. Telkom offers end-to- Trust (“REIT”) that provides shareholders with access to a diversified
end information and communications technology (ICT) solutions, portfolio of direct and indirect global real estate investments. Our
including high-speed fibre, mobile and data services, information portfolio is valued at R1.9 billion as at 30 June 2025 (2024: R2.1
technology (IT) services and property management. billion) and aims to deliver long-term income and capital growth.
SECTOR: Telecoms--Telecoms--TelecomServiceProvider--TelecomServices Our core objective is to deliver sustainable, risk-adjusted returns
NUMBER OF EMPLOYEES: 9 509 to our stakeholders through disciplined capital allocation, strategic
DIRECTORS: Booi M (ind ne), Ighodaro O (ind ne, Nigeria), asset management, and value driven investments.
Kennedy B (ind ne), Lebina K P (ind ne), Luthuli P C S (ind ne), SECTOR: RealEstate--RealEstate--REITS--Office
Matenge-Sebesho E G (ind ne), Msimang M (ind ne), Rayner K A NUMBER OF EMPLOYEES: 20
(ind ne), Selele I (ind ne), Sibisi Dr S P (ind ne), Singh E (ind ne), DIRECTORS: Franco R A (ne), Hannington A J (snr ind ne),
Yoon S H (ne), Qhena M G (Chair, ind ne), Taukobong S (Group CE), van der Vent W C (ind ne), Golding M J A (Chair, ne), Rens J (CEO),
Dlamini N (Group CFO) Welleman H S P (CFO), Macey J (ld ind ne)
MAJOR ORDINARY SHAREHOLDERS as at 10 Jul 2025 MAJOR ORDINARY SHAREHOLDERS as at 30 Jun 2025
The Government of the Republic of South Africa 40.52% Oak Tech Trading (Pty) Ltd. 29.45%
Government Employees Pension Fund 15.89% Thibault REIT Ltd. 19.42%
Public Investment Corporation (SOC) Ltd. 10.25% Kloof Capital South Africa (Pty) Ltd. 14.30%
POSTAL ADDRESS: Private Bag X881, Pretoria, 0001 POSTAL ADDRESS: PO Box 653129, Benmore, 2010
MORE INFO: www.sharedata.co.za/sdo/jse/TKG MORE INFO: www.sharedata.co.za/sdo/jse/TEX
COMPANY SECRETARY: Ephy Motlhamme COMPANY SECRETARY: CorpStat Governance Services (Pty) Ltd.
TRANSFER SECRETARY: Computershare Investor Services (Pty) Ltd. TRANSFER SECRETARY: Computershare Investor Services (Pty) Ltd.
SPONSOR: Nedbank CIB SPONSOR: Investec Bank Ltd.
AUDITORS: PwC Inc. AUDITORS: BDO South Africa Inc.
CAPITAL STRUCTURE Authorised Issued CAPITAL STRUCTURE Authorised Issued
TKG Ords of R10.00 ea 1 000 000 000 511 140 239 TEX Ords no par val 2 000 000 000 330 059 664
DISTRIBUTIONS [ZARc] DISTRIBUTIONS [ZARc]
Ords of R10.00 ea Ldt Pay Amt Ords no par val Ldt Pay Amt
Final No 27 8 Jul 25 14 Jul 25 163.05 Share Premium No 22 24 Oct 25 30 Oct 25 63.74
Special No 18 8 Jul 25 14 Jul 25 97.82 Share Premium No 1 20 May 25 26 May 25 79.87
LIQUIDITY: Apr26 Avg 8m shares p.w., R405.4m(78.6% p.a.) LIQUIDITY: Apr26 Avg 69 225 shares p.w., R215 815.5(1.1% p.a.)
FINANCIAL STATISTICS FINANCIAL STATISTICS
Sep 25 Mar 25 Mar 24 Mar 23 Mar 22 Dec 25 Jun 25 Jun 24 Jun 23 Jun 22
(R million) (R ‘000)
Interim Final Final Final(rst) Final Interim Final Final Final Final
Turnover 22 104 43 880 42 463 41 838 42 756 NetRent/InvInc 69 844 145 840 158 052 184 905 188 505
Op Inc 2 755 5 057 3 903 - 12 567 4 933 Total Inc 74 861 185 650 209 900 225 045 209 340
NetIntPd(Rcvd) 814 1 926 2 127 1 465 1 112 Attrib Inc 23 399 149 056 - 55 642 165 231 39 399
Minority Int - - - 2 1 TotCompInc/Loss - 22 007 149 720 - 55 642 165 231 39 399
Att Inc 1 604 7 503 1 881 - 9 973 2 630 Ord UntHs Int 1 498 228 1 710 281 1 918 794 2 097 014 1 964 371
TotCompInc/Loss 1 574 7 488 1 895 - 9 883 2 897 Investments 262 601 413 258 - - -
Fixed Ass 27 933 27 334 26 002 26 178 38 319 FixedAss/Prop 1 894 512 1 903 328 2 010 727 2 083 749 2 129 569
L-T Invest 113 106 106 108 170 Tot Curr Ass 99 100 139 622 405 588 325 691 161 077
Tot Curr Ass 17 639 23 005 16 216 17 317 16 124 Total Ass 2 262 817 2 473 352 2 966 788 3 141 916 3 410 149
Ord SH Int 33 910 33 601 26 196 24 184 34 069 Tot Curr Liab 48 133 87 577 891 227 179 752 298 541
Minority Int - 19 - 16 - 21 - 23 - 25 PER SHARE STATISTICS (cents per share)
LT Liab 12 320 16 347 17 359 17 550 13 422 HEPS-C (ZARc) 7.09 0.41 2.52 16.54 30.49
Tot Curr Liab 15 798 17 603 17 176 17 913 18 551 DPS (ZARc) - 163.74 20.13 19.26 17.00
PER SHARE STATISTICS (cents per share) NAV PS (ZARc) 503.23 574.61 625.08 619.37 587.28
HEPS-C (ZARc) 305.60 467.50 288.10 - 99.30 575.30 3 Yr Beta 0.45 0.16 0.09 - 0.04 0.58
DPS (ZARc) - 260.87 - - - Price Prd End 375 295 332 250 370
NAV PS (ZARc) 6 634.19 6 573.73 5 125.01 4 731.38 6 665.29 Price High 375 450 334 375 431
3 Yr Beta 0.57 0.72 0.77 1.05 1.56 Price Low 251 226 222 180 275
Price High 6 059 3 918 3 642 5 070 5 980 RATIOS
Price Low 2 985 2 156 2 040 2 908 3 607 RetOnSH Funds 3.11 8.72 - 2.90 7.88 2.01
Price Prd End 5 117 3 713 3 000 3 572 4 448 RetOnTotAss 6.62 7.51 7.07 7.16 5.17
RATIOS Debt:Equity 0.47 0.41 0.51 0.41 0.57
Ret on SH Fnd 9.47 22.34 7.19 - 41.27 7.73 OperRetOnInv 6.48 6.30 7.86 8.87 8.85
Oper Pft Mgn 12.46 11.52 9.19 - 30.04 11.54 OpInc:Turnover 53.82 56.11 57.91 61.91 56.57
D:E 0.39 0.55 0.77 0.82 0.50
Current Ratio 1.12 1.31 0.94 0.97 0.87
Div Cover - 5.86 - - -
190