
Page 154 - Profile's Stock Exchange Handbook - 2026 Issue 2
P. 154
JSE - OLD Profile’s Stock Exchange Handbook: 2026 - Issue 2
Old Mutual Ltd. Omnia Holdings Ltd.
ISIN: ZAE000255360 SHORT: OMUTUAL CODE: OMU ISIN: ZAE000005153 SHORT: OMNIA CODE: OMN
REG NO: 2017/235138/06 FOUNDED: 2017 LISTED: 2018 REG NO: 1967/003680/06 FOUNDED: 1953 LISTED: 1980
NATURE OF BUSINESS: Old Mutual is a premium African financial NATURE OF BUSINESS: Omnia is a global, diversified chemicals
services group that offers a broad spectrum of financial solutions group supplying chemicals and specialised services and solutions
to retail and corporate customers across key market segments in to the agriculture, mining and chemicals application industries.
12 countries. Old Mutual’s primary operations are in Africa, and it SECTOR: Basic Materials--Chemicals--Chemicals--Chemicals:Diversified
has a niche business in Asia. With over 180 years of heritage across NUMBER OF EMPLOYEES: 3 803
sub-Saharan Africa, Old Mutual is a crucial part of the communities DIRECTORS: Binedell Prof N A (ind ne), Cavaleros G (ind ne),
it serves as well as broader society on the continent. Mokgosi-Mwantembe T (ind ne), Plaizier W (ind ne),
SECTOR: Fins--Insurance--Life Insurance--Life Insurance van Dijk R (ind ne), Eboka T N M (Chair, ind ne), Gobalsamy T (CEO),
NUMBER OF EMPLOYEES: 28 116 Serfontein S P (Group FD)
DIRECTORS: Armstrong Dr B (ind ne), Erasmus J (ind ne), MAJOR ORDINARY SHAREHOLDERS as at 9 Mar 2026
Ighodaro O (ind ne), Kgaboesele I (ind ne), Langer J (ind ne), Public Investment Corporation (SOC) Ltd. 20.05%
Lister J R (ind ne, British), Magwentshu-Rensburg Dr S M (ld ind ne), Camissa Asset Management (Pty) Ltd. 14.23%
Mwangi J I (ind ne, Kenyan), Silwanyana B (ind ne), van Graan S W M&G Investments 12.74%
(ind ne), Manuel T (Chair, ind ne), Jardine R (Chair Designate, ind ne), POSTAL ADDRESS: PO Box 69888, Bryanston, 2021
Strydom J J (CEO), Troskie C G (CFO) MORE INFO: www.sharedata.co.za/sdo/jse/OMN
MAJOR ORDINARY SHAREHOLDERS as at 9 Apr 2026 COMPANY SECRETARY: Donna Dickson
Public Investment Corporation 17.34% TRANSFER SECRETARY: JSE Investor Services (Pty) Ltd.
Absa Capital Securities (Pty) Ltd. 5.56% SPONSOR: Java Capital Trustees and Sponsors (Pty) Ltd.
BlackRock Inc 4.50% AUDITORS: Deloitte & Touche Inc.
POSTAL ADDRESS: PO Box 66, Cape Town, South Africa, 8000 CAPITAL STRUCTURE Authorised Issued
MORE INFO: www.sharedata.co.za/sdo/jse/OMU OMN Ords no par val 500 000 000 162 297 200
COMPANY SECRETARY: E M Kirsten
TRANSFER SECRETARY: JSE Investor Services (Pty) Ltd. DISTRIBUTIONS [ZARc]
SPONSOR: Tamela Holdings (Pty) Ltd. Ords no par val Ldt Pay Amt
AUDITORS: Deloitte & Touche Inc., Ernst & Young Final No 65 12 Aug 25 18 Aug 25 400.00
CAPITAL STRUCTURE Authorised Issued Special No 4 12 Aug 25 18 Aug 25 275.00
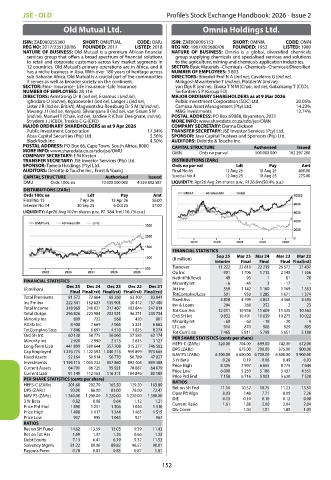
OMU Ords 100c ea 10 000 000 000 4 559 892 587 LIQUIDITY: Apr26 Avg 2m shares p.w., R126.8m(50.4% p.a.)
DISTRIBUTIONS [ZARc]
Ords 100c ea Ldt Pay Amt
Final No 15 7 Apr 26 13 Apr 26 56.00
Interim No 14 30 Sep 25 6 Oct 25 37.00
LIQUIDITY: Apr26 Avg 102m shares p.w., R1 384.1m(116.7% p.a.)
FINANCIAL STATISTICS
Sep 25 Mar 25 Mar 24 Mar 23 Mar 22
(R million)
Interim Final Final Final Final(rst)
Turnover 11 222 22 818 22 219 26 572 21 437
Op Inc 901 1 706 1 712 2 149 1 556
NetIntPd(Rcvd) 49 93 1 81 76
FINANCIAL STATISTICS Minority Int - 6 - 45 3 - 17 -
Dec 25 Dec 24 Dec 23 Dec 22 Dec 21
(R million) Att Inc 550 1 142 1 160 1 169 1 353
Final Final(rst) Final(rst) Final(rst) Final(rst) TotCompInc/Loss 501 950 1 285 1 671 1 374
Total Premiums 81 572 72 664 68 260 63 300 83 841 Fixed Ass 4 828 4 799 4 842 4 566 4 593
Inc Fm Inv 222 541 152 623 135 901 20 412 157 480 Inv & Loans 294 288 252 2 23
Total Income 318 969 240 027 217 407 102 844 247 814 Tot Curr Ass 12 011 10 936 11 609 11 535 10 563
Total Outgo 296 826 223 984 203 551 96 271 235 754 Ord SH Int 9 832 10 491 10 839 10 275 10 022
Minority Int 809 722 568 420 801 Minority Int - 69 - 63 - 19 - 20 - 4
Attrib Inc 8 408 7 669 7 065 5 231 6 662 LT Liab 914 870 908 929 805
TotCompInc/Loss 7 846 6 697 4 510 1 825 8 274 Tot Curr Liab 7 465 5 811 5 798 5 651 5 188
Ord SH Int 60 138 58 775 56 060 57 585 62 174 PER SHARE STATISTICS (cents per share)
Minority Int 2 920 2 990 2 515 2 615 3 127 HEPS-C (ZARc) 320.00 704.00 699.00 742.00 672.00
Long-Term Liab 441 809 389 644 357 708 315 277 746 562
Cap Employed 1 276 774 1 122 592 1 040 715 959 899 973 665 DPS (ZARc) - 675.00 700.00 375.00 800.00
Fixed Assets 52 164 50 914 56 770 50 789 47 827 NAV PS (ZARc) 6 200.00 6 600.00 6 700.00 6 300.00 5 900.00
0.26
3 Yr Beta
- 0.06
0.19
0.49
0.93
Investments 1 194 115 1 035 232 957 860 892 404 899 388 Price High 8 305 7 997 6 655 8 775 7 644
Current Assets 64 791 86 725 95 921 78 887 64 079
Current Liab 91 149 112 163 116 311 104 846 80 189 Price Low 6 000 5 250 5 186 5 437 4 551
6 716
7 158
Price Prd End
5 620
5 903
7 520
PER SHARE STATISTICS (cents per share) RATIOS
HEPS-C (ZARc) 201.60 202.70 165.50 129.20 163.80
DPS (ZARc) 93.00 86.00 81.00 76.00 72.47 Ret on SH Fnd 11.14 10.52 10.75 11.23 13.51
7.71
7.48
8.03
8.09
Oper Pft Mgn
7.26
NAV PS (ZARc) 1 340.00 1 290.00 1 220.00 1 230.00 1 390.00 D:E 0.13 0.10 0.10 0.12 0.08
3 Yr Beta 0.82 0.98 0.64 1.12 1.21
Price Prd End 1 490 1 251 1 306 1 046 1 310 Current Ratio 1.61 - 1.88 2.00 2.04 2.04
1.85
1.01
Div Cover
1.01
1.03
Price High 1 498 1 417 1 344 1 465 1 515
Price Low 937 995 1 043 921 967
RATIOS
Ret on SH Fund 14.62 13.59 13.03 9.39 11.43
Ret on Tot Ass 1.69 1.37 1.26 0.66 1.23
Debt:Equity 7.13 6.41 6.19 5.32 11.52
Solvency Mgn% 81.22 89.06 89.82 96.57 90.01
Payouts:Prem 0.78 0.83 0.83 0.87 1.81
152