
Page 153 - Profile's Stock Exchange Handbook - 2026 Issue 2
P. 153
Profile’s Stock Exchange Handbook: 2026 - Issue 2 JSE - OCE
Oceana Group Ltd. Octodec Investments Ltd.
ISIN: ZAE000025284 ISIN: ZAE000192258
SHORT: OCEANA SHORT: OCTODEC
CODE: OCE CODE: OCT
REG NO: 1939/001730/06 REG NO: 1956/002868/06
FOUNDED: 1918 FOUNDED: 1956
LISTED: 1947 LISTED: 1990
NATURE OF BUSINESS: The Oceana Group is a diversified NATURE OF BUSINESS: Octodec Investments Ltd. (Octodec or the
international fish and food company with a strong, experienced company), its subsidiaries and associated company (the group) is
management team, and businesses that operate across the full a real estate investment trust (REIT) listed on the JSE Ltd. (JSE) with
value-chain which includes catching or procuring, processing, a diversified portfolio of 219 residential, retail, office and industrial
distributing, and selling. It is Africa’s largest fishing company properties situated in the major metropolitan areas of Tshwane and
with a history dating back over 105 years. The Group operates 65 Johannesburg. The portfolio, including an equity-accounted joint
vessels and 8 production facilities across three countries on two venture, has a lettable area of 1 473 227m2 and is valued at R11.2 billion.
continents, selling products to customers in 39 countries. SECTOR: RealEstate--RealEstate--REITS--Retail
SECTOR: ConsStaples--Food,Beverage&Tobacco--Food Producers--Farmers NUMBER OF EMPLOYEES: 183
NUMBER OF EMPLOYEES: 3 637 DIRECTORS: Erasmus R (Deputy CEO & FD), Bhikha S R (ind ne),
DIRECTORS: Doyle N P (ind ne), Golesworthy P J (ind ne), Jakoet A Lockhart-Ross R (ind ne), Buchholz R (ind ne), Mabunda N C (ind ne),
(ld ind ne), Mahlare M M (ind ne), Mokgosi-Mwantembe T (ind ne), Mojapelo E M S (ind ne), Pollack M Z (ne), Van Breda L P (ind ne),
de Beyer P (ne), Pangarker N A (ne), Sennelo L J (ind ne), Viranna P Wapnick J P (CEO), Wapnick S (Chair, ne)
(ind ne), Brey M A (Chair, ne), Brink N (CEO), Mahomed Z (CFO) MAJOR ORDINARY SHAREHOLDERS as at 31 Aug 2025
MAJOR ORDINARY SHAREHOLDERS as at 3 Mar 2026 Catalyst Fund Managers (Pty) Ltd. 9.87%
Newshelf 1063 (RF) (Pty) Ltd. 16.01% Lefkopaul CC 7.59%
Public Investment Corporation (SOC) Ltd. 15.80% Tomnef Investments (Pty) Ltd. 6.89%
Allan Gray (Pty) Ltd. 14.47% POSTAL ADDRESS: PO Box 15, Tshwane, 0001
POSTAL ADDRESS: PO Box 7206, Roggebaai, 8012 EMAIL: info@octodec.co.za
EMAIL: companysecretary@oceana.co.za WEBSITE: www.octodec.co.za
WEBSITE: www.oceana.co.za TELEPHONE: 012-319-8781
TELEPHONE: 021-410-1400 COMPANY SECRETARY: Elize Greeff
COMPANY SECRETARY: Satish Bhoola TRANSFER SECRETARY: Computershare Investor Services (Pty) Ltd.
TRANSFER SECRETARY: JSE Investor Services (Pty) Ltd. SPONSOR: Java Capital, Nedbank Corporate and Investment Banking
SPONSOR: Standard Bank of South Africa Ltd. AUDITORS: Ernst & Young Inc.
AUDITORS: Forvis Mazars CAPITAL STRUCTURE Authorised Issued
CAPITAL STRUCTURE Authorised Issued
OCE Ords no par val 300 000 000 129 779 645 OCT Ords no par val 500 000 000 266 197 535
DISTRIBUTIONS [ZARc] DISTRIBUTIONS [ZARc]
Ords no par val Ldt Pay Amt Ords no par val Ldt Pay Amt
Final No 164 19 Dec 25 29 Dec 25 175.00 Final No 68 9 Dec 25 15 Dec 25 72.50
Interim No 163 24 Jun 25 30 Jun 25 110.00 Interim No 67 27 May 25 2 Jun 25 62.00
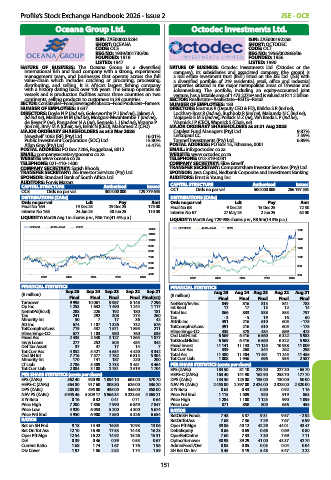
LIQUIDITY: Mar26 Avg 1m shares p.w., R56.7m(41.5% p.a.) LIQUIDITY: Mar26 Avg 729 988 shares p.w., R8.5m(14.3% p.a.)
OCEANA 40 Week MA FOOD OCTODEC 40 Week MA REIV
12000 1600
11000
10000 1400
9000
1200
8000
7000 1000
6000
800
5000
4000 600
2022 2023 2024 2025 2026
2022 2023 2024 2025 2026
FINANCIAL STATISTICS FINANCIAL STATISTICS
Sep 25 Sep 24 Sep 23 Sep 22 Sep 21 Aug 25 Aug 24 Aug 23 Aug 22 Aug 21
(R million) (R million)
Final Final Final Final Final(rst) Final Final Final Final Final
Turnover 9 995 10 061 9 987 8 148 7 296 NetRent/InvInc 849 816 813 841 783
Op Inc 1 253 1 632 1 490 1 244 1 117 Int Recd 17 17 13 12 14
NetIntPd(Rcvd) 288 226 192 180 181 Total Inc 866 833 838 853 797
Tax 241 292 308 273 260 Tax - 3 - 5 19 16 60
Minority Int 50 7 17 36 42 Attrib Inc 491 216 610 605 - 175
Att Inc 674 1 107 1 326 732 676 TotCompInc/Loss 491 216 610 605 - 175
TotCompInc/Loss 719 437 1 571 1 895 211
434
689
473
435
378
Hline Erngs-CO 677 1 103 980 760 635 Hline Erngs-CO 6 569 6 416 6 560 6 322 5 983
Ord UntHs Int
Fixed Ass 2 435 2 540 2 127 1 865 1 877
Inv & Loans 277 252 505 484 342 TotStockHldInt 6 569 6 416 6 560 6 322 5 983
Def Tax Asset 37 47 17 14 7 Fixed Invest 11 141 11 133 11 135 10 938 11 009
Tot Curr Ass 4 852 5 421 4 634 4 420 3 342 Tot Curr Ass 339 268 344 262 298
Ord SH Int 7 716 7 577 7 782 6 813 5 304 Total Ass 11 480 11 404 11 491 11 245 11 455
Minority Int 170 141 187 220 200 Tot Curr Liab 1 008 1 946 696 955 2 587
LT Liab 2 786 3 309 2 733 3 461 3 464 PER SHARE STATISTICS (cents per share)
Tot Curr Liab 2 884 3 108 2 781 2 519 1 704 EPS (ZARc) 184.50 81.10 229.30 227.30 - 65.70
PER SHARE STATISTICS (cents per share) HEPS-C (ZARc) 163.40 141.90 162.90 258.70 177.70
EPS (ZARc) 562.40 920.90 1 094.10 603.00 570.70 DPS (ZARc) 134.50 125.00 135.00 130.00 50.00
HEPS-C (ZARc) 564.80 917.60 808.80 626.00 536.20 NAV PS (ZARc) 2 455.00 2 397.00 2 424.00 2 328.00 2 320.00
DPS (ZARc) 285.00 495.00 435.00 346.00 358.00 3 Yr Beta 0.63 0.43 0.80 0.92 1.16
NAV PS (ZARc) 5 945.46 5 809.17 5 966.34 5 223.65 4 369.21 Price Prd End 1 115 1 089 920 919 863
3 Yr Beta 0.16 0.32 0.41 0.71 0.64 Price High 1 284 1 100 1 125 990 1 095
Price High 7 200 7 850 7 990 6 849 7 847 Price Low 871 850 800 656 455
Price Low 4 920 6 053 5 200 4 300 5 674 RATIOS
Price Prd End 4 950 6 900 7 550 5 326 6 654 RetOnSH Funds 7.48 3.37 9.31 9.57 - 2.92
RATIOS RetOnTotAss 7.68 7.36 7.29 7.67 6.99
Ret on SH Fnd 9.18 14.43 16.85 10.93 13.06 Oper Pft Mgn 39.86 40.12 42.29 44.01 43.47
Ret On Tot Ass 12.10 16.48 17.53 14.48 16.23 Debt:Equity 0.66 0.69 0.66 0.69 0.80
Oper Pft Mgn 12.54 16.22 14.92 15.26 15.31 OperRetOnInv 7.60 7.33 7.30 7.69 7.11
D:E 0.39 0.46 0.39 0.53 0.67 OpInc:Turnover 38.98 39.29 41.00 43.37 42.70
Current Ratio 1.68 1.74 1.67 1.76 1.96 AdminFee:T/Ovr 0.05 0.05 0.05 0.04 0.04
Div Cover 1.97 1.86 2.52 1.74 1.59 SH Ret On Inv 5.45 5.19 5.48 5.47 2.22
151