
Page 66 - Profile's Stock Exchange Handbook - 2025 Issue 3
P. 66
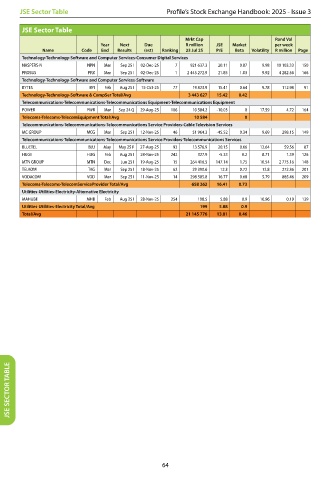
JSE Sector Table                         Profile’s Stock Exchange Handbook: 2025 - Issue 3


       JSE Sector Table
                                                      Mrkt Cap                 Rand Val
                              Year   Next   Due       R million   JSE  Market   per week
             Name       Code  End  Results  (est)  Ranking  23 Jul 25  P/E  Beta  Volatility  R million  Page
       Technology-Technology-Software and Computer Services-Consumer Digital Services
       NASPERS-N          NPN  Mar  Sep 25 I  02-Dec-25  7   921 637.3  20.11  0.87  9.98   10 103.33  150
       PROSUS             PRX  Mar  Sep 25 I  02-Dec-25  1  2 445 272.9  21.85  1.03  9.92   4 282.56  166
       Technology-Technology-Software and Computer Services-Software
       BYTES              BYI  Feb  Aug 25 I  15-Oct-25  77   19 823.9  15.41  0.64  9.78  112.98  91
       Technology-Technology-Software & CompSer Total/Avg    3 443 627  15 .42  0 .42
       Telecommunications-Telecommunications-Telecommunications Equipment-Telecommunications Equipment
       POWER              PWR  Mar  Sep 24 Q  29-Aug-25  106   10 584.2  -10.03  0  17.59  4.72  164
       Telecoms-Telecoms-TelecomEquipment Total/Avg       10 584       0
       Telecommunications-Telecommunications-Telecommunications Service Providers-Cable Television Services
       MC GROUP           MCG  Mar  Sep 25 I  12-Nov-25  46   51 964.3  -45.52  0.34  9.69  298.15  149
       Telecommunications-Telecommunications-Telecommunications Service Providers-Telecommunications Services
       BLUETEL            BLU  May  May 25 F  27-Aug-25  93   13 576.9  20.15  0.66  12.64  59.56  87
       HUGE               HUG  Feb  Aug 25 I  28-Nov-25  242  327.9  -5.33  0.2  8.71  1.39  126
       MTN GROUP          MTN  Dec  Jun 25 I  19-Aug-25  15   264 416.5  147.14  1.75  10.54   2 775.16  148
       TELKOM             TKG  Mar  Sep 25 I  18-Nov-25  62   29 390.6  12.3  0.72  12.8  272.36  201
       VODACOM            VOD  Mar  Sep 25 I  11-Nov-25  14   298 585.8  16.77  0.68  5.79  885.46  209
       Telecoms-Telecoms-TelecomServiceProvider Total/Avg     658 262  16 .41  0 .73
       Utilities-Utilities-Electricity-Alternative Electricity
       MAHUBE             MHB  Feb  Aug 25 I  28-Nov-25  254  198.5  5.88  0.9  10.96  0.19  139
       Utilities-Utilities-Electricity Total/Avg          199  5 .88  0 .9
       Total/Avg                                       21 145 776  13 .81  0 .46


    JSE SECTOR TABLE


                                               64