
Page 71 - Profile's Stock Exchange Handbook - 2025 Issue 2
P. 71
Profile’s Stock Exchange Handbook: 2025 – Issue 2 JSE – ADC
Adcock Ingram Holdings Ltd. Adcorp Holdings Ltd.
ADC ADC
ISIN: ZAE000123436 SHORT: ADCOCK CODE: AIP ISIN: ZAE000000139 SHORT: ADCORP CODE: ADR
REG NO: 2007/016236/06 FOUNDED: 1890 LISTED: 2008 REG NO: 1974/001804/06 FOUNDED: 1968 LISTED: 1987
NATURE OF BUSINESS: Adcock Ingram is a leading South African NATURE OF BUSINESS: The Adcorp Group is a workforce solutions
pharmaceutical manufacturer, listed on the Johannesburg Stock Exchange. provider that seeks to connect and develop human potential to shape
The Group manufactures, markets, and distributes a wide range of markets, economies and our shared future. Adcorp and its constituent
consumer and healthcare products and is a leading supplier to the private brands are represented within South Africa and Australia, employing in
and public sectors of the market. excessof1 900 permanentstaff,assigning morethan48 000 contingentstaff
SECTOR: HlthCare—HtlhCare—Pharmaceutic&Biotech—Pharmaceuticals dailyandtrainingmultiplelearnersthroughavastspectrumofdisciplines.
NUMBER OF EMPLOYEES: 2 223 SECTOR: Inds—IndsGoods&Services—IndsSupptServ—BusTrain&EmpAgency
DIRECTORS: Letsoalo B (HR), Boyce L (ne), Gumbi Dr S (ind ne), NUMBER OF EMPLOYEES: 1 959
MabuzaBA(ind ne), Manning DrCE(ind ne), Ransby D (ind ne), DIRECTORS: Lubega M (ind ne), Mnganga Dr P (ld ind ne), Mokgabudi T
Sathekge Prof M (ind ne), Steyn M (ne), Madisa N T (Chair, ne), (ind ne), Singh H (ind ne), Smith C (ne), van Dijk R (ind ne),
Hall A G (CEO), Neethling D (CFO) Serobe G T (Chair, ind ne), Wentzel Dr J P (CEO), Prendergast N (CFO)
MAJOR ORDINARY SHAREHOLDERS as at 30 Jun 2024 MAJOR ORDINARY SHAREHOLDERS as at 28 Feb 2024
The Bidvest Group Ltd. 59.00% H4 Collective Investments (RF) (Pty) Ltd. 11.16%
Government Employees Pension Fund 8.80% Allan Gray 8.82%
POSTAL ADDRESS: Private Bag X69, Bryanston, 2021 PSG Asset Management (Pty) Ltd. 8.01%
MORE INFO: www.sharedata.co.za/sdo/jse/AIP POSTAL ADDRESS: PO Box 70635, Bryanston, 2021
COMPANY SECRETARY: Mahlatse Phalafala MORE INFO: www.sharedata.co.za/sdo/jse/ADR
TRANSFER SECRETARY: Computershare Investor Services (Pty) Ltd. COMPANY SECRETARY: Charissa de Jager
SPONSOR: Rand Merchant Bank (A division of FirstRand Bank Ltd.) TRANSFER SECRETARY: CTSE Registry Services (Pty) Ltd.
AUDITORS: PwC Inc. SPONSOR: Valeo Capital (Pty) Ltd.
AUDITORS: Deloitte & Touche Inc.
CAPITAL STRUCTURE AUTHORISED ISSUED
AIP Ords 10c ea 250 000 000 161 300 000 CAPITAL STRUCTURE AUTHORISED ISSUED
ADR Ords 2.5c ea 183 177 151 109 880 974
DISTRIBUTIONS [ZARc]
Ords 10c ea Ldt Pay Amt DISTRIBUTIONS [ZARc]
Interim No 26 11 Mar 25 17 Mar 25 115.00 Ords 2.5c ea Ldt Pay Amt
Final No 25 17 Sep 24 23 Sep 24 150.00 Interim No 42 14 Jan 25 20 Jan 25 13.40
Final No 41 13 Aug 24 19 Aug 24 24.20
LIQUIDITY: Apr25 Avg 448 263 shares p.w., R26.3m(14.5% p.a.)
LIQUIDITY: Apr25 Avg 310 459 shares p.w., R1.4m(14.7% p.a.)
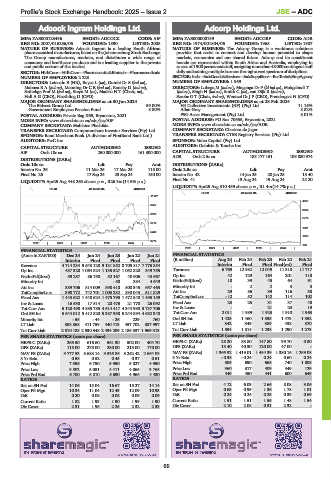
PHAR 40 Week MA ADCOCK
SUPS 40 Week MA ADCORP
11127
4527
9657
3652
8186
2776
6716
1901
5246
1025
3776
2020 | 2021 | 2022 | 2023 | 2024 |
150
2020 | 2021 | 2022 | 2023 | 2024 |
FINANCIAL STATISTICS
(Amts in ZAR’000) Dec 24 Jun 24 Jun 23 Jun 22 Jun 21 FINANCIAL STATISTICS
Interim Final Final Final Final (R million) Aug 24 Feb 24 Feb 23 Feb 22 Feb 21
Revenue 4 714 234 9 643 128 9 131 852 8 705 817 7 776 854 Interim Final Final Final(rst) Final
Op Inc 487 328 1 064 824 1 135 527 1 052 820 849 755 Turnover 6 769 12 982 12 049 11 318 11 717
NetIntPd(Rcvd) 59 287 86 758 52 167 40 906 43 667 Op Inc 42 129 164 201 118
Minority Int - - - 50 384 4 649 NetIntPd(Rcvd) 18 39 45 64 91
Att Inc 389 706 814 009 898 410 800 345 657 463 Minority Int - 2 2 3 3
TotCompIncLoss 398 772 742 701 1 003 232 830 043 511 829 Att Inc 29 86 39 116 38
Fixed Ass 1 443 622 1 448 624 1 475 795 1 472 548 1 495 159 TotCompIncLoss - 12 52 142 114 102
Inv & Loans 16 530 17 514 20 476 21 770 26 092 Fixed Ass 23 25 31 37 48
Tot Curr Ass 5 120 498 4 885 785 4 614 417 4 344 990 3 737 706 Inv & Loans - - 21 20 19
Ord SH Int 5 544 012 5 412 820 5 387 938 5 244 894 4 682 348 Tot Curr Ass 2 011 1 989 1 923 1 910 1 963
Minority Int - 55 - 44 - 26 229 760 Ord SH Int 1 425 1 460 1 535 1 473 1 352
LT Liab 388 868 411 759 440 413 457 702 387 997 LT Liab 342 349 389 438 870
Tot Curr Liab 2 810 188 2 530 348 2 434 209 2 186 337 1 969 313 Tot Curr Liab 1 334 1 314 1 238 1 290 1 273
PER SHARE STATISTICS (cents per share) PER SHARE STATISTICS (cents per share)
HEPS-C (ZARc) 265.50 616.60 561.30 502.00 404.70 HEPS-C (ZARc) 28.20 83.80 147.80 99.70 0.80
DPS (ZARc) 115.00 275.00 250.00 213.00 170.00 DPS (ZARc) 13.40 40.30 120.00 47.00 -
NAV PS (ZARc) 3 777.53 3 688.14 3 526.86 3 242.42 2 664.08 NAV PS (ZARc) 1 366.92 1 419.01 1 484.39 1 380.16 1 259.08
3 Yr Beta 0.58 0.52 0.45 0.37 0.51 3 Yr Beta - 0.38 - 0.24 0.24 0.60 0.24
Price High 7 396 6 750 5 950 5 827 4 950 Price High 505 690 668 740 1 008
Price Low 5 502 5 051 4 411 4 065 3 765 Price Low 360 317 409 449 129
Price Prd End 6 700 6 010 5 630 4 966 4 430 Price Prd End 449 450 441 600 649
RATIOS RATIOS
Ret on SH Fnd 14.06 15.04 16.67 15.27 14.14 Ret on SH Fnd 4.12 6.03 2.66 8.08 3.06
Oper Pft Mgn 10.34 11.04 12.43 12.09 10.93 Oper Pft Mgn 0.63 0.99 1.36 1.78 1.01
D:E 0.20 0.08 0.08 0.09 0.09 D:E 0.24 0.24 0.25 0.39 0.69
Current Ratio 1.82 1.93 1.90 1.99 1.90 Current Ratio 1.51 1.51 1.55 1.48 1.54
Div Cover 2.31 1.96 2.25 2.32 2.33 Div Cover 2.10 2.08 0.31 2.32 -
69