
Page 67 - Profile's Stock Exchange Handbook - 2025 Issue 2
P. 67
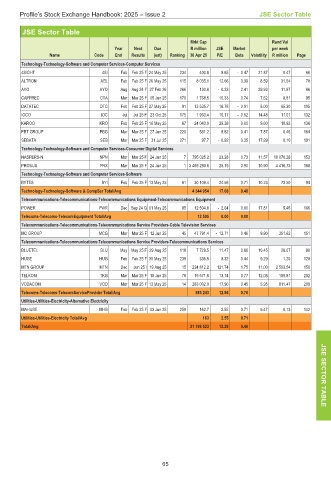
Profile’s Stock Exchange Handbook: 2025 – Issue 2                   JSE Sector Table

       JSE Sector Table
                                                       Mrkt Cap               Rand Val
                                  Year  Next  Due      R million  JSE  Market  per week
               Name         Code  End  Results  (est)  Ranking  30 Apr 25  P/E  Beta  Volatility  R million  Page
       Technology-Technology-Software and Computer Services-Computer Services
       4SIGHT                 4SI  Feb Feb 25 F 24 May 25  234  400.8  9.65  - 0.47  21.87  0.47  66
       ALTRON                 AEL  Feb Feb 25 F 26 May 25  115  8 035.1  12.66  0.39  8.59  31.64  78
       AYO                   AYO   Aug Aug 24 F 27 Feb 26  266  130.8  - 0.23  2.41  29.93  11.97  86
       CAPPREC                CTA  Mar Mar 25 F 05 Jun 25  179  1 768.5  10.33  0.74  7.62  8.81  95
       DATATEC               DTC   Feb Feb 25 F 27 May 25  91  13 535.7  16.78  - 0.91  8.00  65.30  105
       IOCO                   IOC   Jul  Jul 25 F 23 Oct 25  175  1 933.4  10.17  - 0.52  14.48  11.01  132
       KAROO                 KRO   Feb Feb 25 F 16 May 25  67  24 043.0  29.38  0.00  9.60  10.93  136
       PBT GROUP             PBG   Mar Mar 25 F 27 Jun 25  220  581.2  8.82  0.41  7.87  0.46  164
       SEBATA                 SEB  Mar Mar 25 F 31 Jul 25  271  97.7  - 0.92  0.35  17.99  0.10  191
       Technology-Technology-Software and Computer Services-Consumer Digital Services
       NASPERS-N             NPN   Mar Mar 25 F 24 Jun 25  7  795 025.2  23.28  0.73  11.57  10 076.28  153
       PROSUS                PRX   Mar Mar 25 F 24 Jun 25  1 3 469 293.6  25.19  0.90  10.90  4 416.73  168
       Technology-Technology-Software and Computer Services-Software
       BYTES                  BYI  Feb Feb 25 F 13 May 25  61  30 109.4  24.56  0.71  10.23  73.50  94
       Technology-Technology-Software & CompSer Total/Avg  4 344 954  17.08  0.40
       Telecommunications-Telecommunications-Telecommunications Equipment-Telecommunications Equipment
       POWER                 PWR   Dec Sep 24 Q 01 May 25  95  12 504.8  - 2.64  0.00  17.81  5.45  166
       Telecoms-Telecoms-TelecomEquipment Total/Avg      12 505  0.00  0.00
       Telecommunications-Telecommunications-Telecommunications Service Providers-Cable Television Services
       MC GROUP              MCG   Mar Mar 25 F 12 Jun 25  45  47 791.4  - 12.71  0.46  9.90  351.62  151
       Telecommunications-Telecommunications-Telecommunications Service Providers-Telecommunications Services
       BLUETEL                BLU  May May 25 F 29 Aug 25  118  7 729.5  11.47  0.66  10.45  28.07  90
       HUGE                  HUG   Feb Feb 25 F 30 May 25  239  336.5  8.32  0.44  9.29  1.20  128
       MTN GROUP             MTN   Dec  Jun 25 I 19 Aug 25  15  224 812.2  121.74  1.75  11.00  2 503.54  150
       TELKOM                TKG   Mar Mar 25 F 10 Jun 25  78  19 571.6  13.74  0.77  12.08  189.81  202
       VODACOM               VOD   Mar Mar 25 F 13 May 25  14  283 002.0  17.90  0.45  5.95  811.47  209
       Telecoms-Telecoms-TelecomServiceProvider Total/Avg  583 243  12.86  0.76
       Utilities-Utilities-Electricity-Alternative Electricity
       MAHUBE                MHB   Feb Feb 25 F 03 Jun 25  259  162.7  2.55  0.71  9.47  0.13  142
       Utilities-Utilities-Electricity Total/Avg           163  2.55  0.71
       Total/Avg                                       21 198 523  12.29  0.46              JSE


                                                                                            SECTOR


                                               65                                           TABLE