
Page 65 - Profile's Stock Exchange Handbook - 2025 Issue 2
P. 65
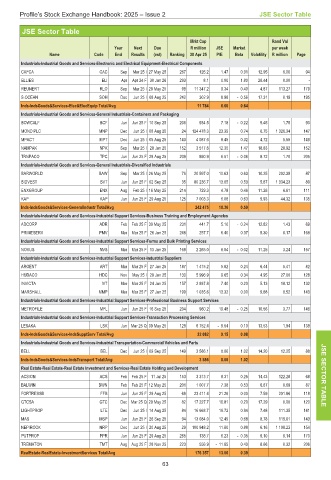
Profile’s Stock Exchange Handbook: 2025 – Issue 2                   JSE Sector Table

       JSE Sector Table
                                                       Mrkt Cap               Rand Val
                                  Year  Next  Due      R million  JSE  Market  per week
               Name         Code  End  Results  (est)  Ranking  30 Apr 25  P/E  Beta  Volatility  R million  Page
       Industrials-Industrial Goods and Services-Electronic and Electrical Equipment-Electrical Components
       CAFCA                 CAC   Sep  Mar 25 I 27 May 25  267  126.2  1.47  0.91  12.95  0.00  94
       ELLIES                 ELI  Apr  Apr 24 F 30 Jan 26  293  8.1  0.00  1.80  28.44  0.00  -
       REUNERT               RLO   Sep  Mar 25 I 28 May 25  98  11 347.2  9.34  0.40  4.87  113.27  179
       S.OCEAN               SOH   Dec  Jun 25 I 08 Aug 25  242  302.9  8.98  - 0.56  17.31  0.19  195
       Inds-IndsGoods&Services-Elec&ElecEquip Total/Avg  11 784  6.60  0.64
       Industrials-Industrial Goods and Services-General Industrials-Containers and Packaging
       BOWCALF               BCF   Jun  Jun 25 F 10 Sep 25  206  934.5  7.18  - 0.22  9.45  1.75  90
       MONDIPLC              MNP   Dec  Jun 25 I 08 Aug 25  24  124 478.3  23.39  0.74  6.75  1 326.34  147
       MPACT                 MPT   Dec  Jun 25 I 05 Aug 25  143  4 087.6  8.45  0.32  4.72  5.55  149
       NAMPAK                NPK   Sep  Mar 25 I 28 Jun 25  152  3 517.6  12.35  1.47  18.83  28.92  152
       TRNPACO               TPC   Jun  Jun 25 F 28 Aug 25  209  890.9  6.51  - 0.06  9.72  1.70  205
       Industrials-Industrial Goods and Services-General Industrials-Diversified Industrials
       BARWORLD              BAW   Sep  Mar 25 I 26 May 25  76  20 597.0  10.63  0.63  10.25  202.39  87
       BIDVEST                BVT  Jun  Jun 25 F 02 Sep 25  35  80 236.7  13.05  0.53  5.87  1 334.23  89
       ENXGROUP              ENX   Aug  Feb 25 I 16 May 25  214  729.3  4.78  0.46  11.28  6.61  111
       KAP                   KAP   Jun  Jun 25 F 29 Aug 25  125  7 003.3  6.88  0.63  9.93  44.32  135
       Inds-IndsGoods&Services-GeneralIndustr Total/Avg  242 475  10.36  0.50
       Industrials-Industrial Goods and Services-Industrial Support Services-Business Training and Employment Agencies
       ADCORP                ADR   Feb Feb 25 F 30 May 25  231  441.7  5.10  - 0.24  12.82  1.43  69
       PRIMESERV             PMV   Mar Mar 25 F 26 Jun 25  248  257.7  6.40  0.37  9.30  0.17  168
       Industrials-Industrial Goods and Services-Industrial Support Services-Forms and Bulk Printing Services
       NOVUS                 NVS   Mar Mar 25 F 13 Jun 25  168  2 265.0  6.04  - 0.02  11.25  3.24  157
       Industrials-Industrial Goods and Services-Industrial Support Services-Industrial Suppliers

       ARGENT                ART   Mar Mar 25 F 27 Jun 25  187  1 415.2  5.82  0.24  6.44  5.41  82
       HUDACO                HDC   Nov  May 25 I 28 Jun 25  130  5 996.9  9.65  0.34  4.95  27.00  128
       INVICTA                IVT  Mar Mar 25 F 24 Jun 25  157  2 937.8  7.40  0.20  5.13  18.12  132
       MARSHALL              MMP   Mar Mar 25 F 27 Jun 25  199  1 035.6  13.32  0.00  9.88  0.52  143
       Industrials-Industrial Goods and Services-Industrial Support Services-Professional Business Support Services
       METROFILE             MFL   Jun  Jun 25 F 16 Sep 25  204  980.2  19.48  - 0.25  16.56  3.77  146
       Industrials-Industrial Goods and Services-Industrial Support Services-Transaction Processing Services
       LESAKA                 LSK  Jun Mar 25 Q 09 May 25  128  6 752.4  - 9.54  0.10  13.53  1.94  138
       Inds-IndsGoods&Services-IndsSupptServ Total/Avg   22 082  9.15  0.08
       Industrials-Industrial Goods and Services-Industrial Transportation-Commercial Vehicles and Parts
       BELL                   BEL  Dec  Jun 25 I 09 Sep 25  149  3 586.1  8.06  1.02  14.20  12.25  88  JSE
       Inds-IndsGoods&Services-IndsTransport Total/Avg    3 586  8.06  1.02
       Real Estate-Real Estate-Real Estate Investment and Services-Real Estate Holding and Development  SECTOR
       ACSION                ACS   Feb Feb 25 F 11 Jul 25  153  3 313.7  8.31  0.25  14.43  122.28  68
       BALWIN                BWN   Feb Feb 25 F 12 May 25  201  1 007.7  7.38  0.53  6.67  0.69  87
       FORTRESSB              FFB  Jun  Jun 25 F 29 Aug 25  69  23 411.4  21.26  0.00  7.59  201.86  118  TABLE
       GTCSA                 GTC   Dec Mar 25 Q 29 May 25  82  17 227.7  16.81  0.20  17.29  0.00  120
       LIGHTPROP              LTE  Dec  Jun 25 I 14 Aug 25  84  16 668.7  19.72  0.94  7.48  111.35  141
       MAS                   MSP   Jun  Jun 25 F 26 Sep 25  94  13 084.0  12.49  0.68  8.78  119.61  143
       NEPIROCK              NRP   Dec  Jun 25 I 20 Aug 25  29  100 948.2  11.80  0.88  6.16  1 108.23  154
       PUTPROP               PPR   Jun  Jun 25 F 29 Aug 25  265  138.7  6.23  - 0.35  9.10  0.14  170
       TREMATON              TMT   Aug Aug 25 F 28 Nov 25  223  556.9  - 11.85  0.40  8.66  0.32  206
       RealEstate-RealEstate-InvestmentServices Total/Avg  176 357  13.00  0.39
                                               63