
Page 122 - Profile's Stock Exchange Handbook - 2025 Issue 2
P. 122
JSE – GLE Profile’s Stock Exchange Handbook: 2025 – Issue 2
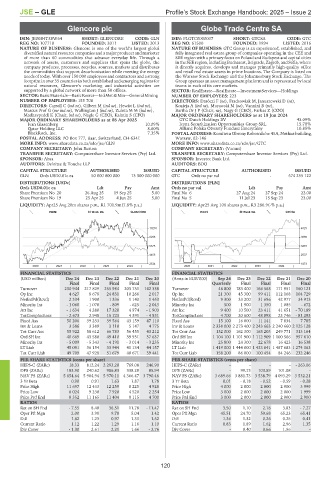
Glencore plc Globe Trade Centre SA
GLE GLO
ISIN: JE00B4T3BW64 SHORT: GLENCORE CODE: GLN ISIN: PLGTC0000037 SHORT: GTCSA CODE: GTC
REG NO: 107710 FOUNDED: 2011 LISTED: 2013 REG NO: 61500 FOUNDED: 1994 LISTED: 2016
NATURE OF BUSINESS: Glencore is one of the world’s largest global NATURE OF BUSINESS: GTC Group is an experienced, established, and
diversified natural resource companies and a major producer and marketer fully integrated real estate group of companies operating in the CEE and
of more than 60 commodities that advance everyday life. Through a SEE region with a primary focus on Poland and Budapest and capital cities
network of assets, customers and suppliers that spans the globe, the in the SEE region, including Bucharest, Belgrade, Zagreb, and Sofia, where
company produces, processes, recycles, sources, markets and distributes it directly acquires, develops and manages primarily high-quality office
the commodities that support decarbonisation while meeting the energy and retail real estate assets in prime locations. The Company is listed on
needs of today. With over 150 000 employees and contractors and a strong the Warsaw Stock Exchange and the Johannesburg Stock Exchange. The
footprint in over 35 countries in both established and emerging regions for Group operates an asset management platform and is represented by local
natural resources, Glencore’s marketing and industrial activities are teams in each of its core markets.
supported by a global network of more than 50 offices. SECTOR: RealEstate—RealEstate—InvestmentServices—Holdings
SECTOR:BasicMaterials—BasicResrcs—IndMet&Min—GeneralMining NUMBER OF EMPLOYEES: 223
NUMBER OF EMPLOYEES: 155 708 DIRECTORS: Daróczi F (ne), Frackowiak M, Januszewski D (ne),
DIRECTORS: Carroll C (ind ne), Gilbert M (ind ne), Hewitt L (ind ne), Kozieja A (ind ne), Murawski M (ne), Vannini B (ne),
Marcus Prof G (snr ind ne), Wallington J (ind ne), ZuletaMM(ind ne), Bartha Dr J P (Chair, ne), Nagy G (CEO), Farkas Z (COO)
Madhavpeddi K (Chair, ind ne), Nagle G (CEO), Kalmin S (CFO) MAJOR ORDINARY SHAREHOLDERS as at 18 Jun 2024
MAJOR ORDINARY SHAREHOLDERS as at 08 Apr 2025 GTC Dutch Holdings BV 43.09%
Ivan Glasenberg 10.09% Icona Securitization Opportunities Group SRL 15.70%
Qatar Holding LLC 8.60% Allianz Polska Otwarty Fundusz Emerytalny 10.85%
BlackRock, Inc. 7.35% POSTAL ADDRESS: Komitetu Obrony Robotników 45A, Nothus building,
POSTAL ADDRESS: PO Box 777, Baar, Switzerland, CH-6341 Warsaw, 02-146
MORE INFO: www.sharedata.co.za/sdo/jse/GLN MORE INFO: www.sharedata.co.za/sdo/jse/GTC
COMPANY SECRETARY: John Burton COMPANY SECRETARY: (Vacant)
TRANSFER SECRETARY: Computershare Investor Services (Pty) Ltd. TRANSFER SECRETARY: Computershare Investor Services (Pty) Ltd.
SPONSOR: Absa SPONSOR: Investec Bank Ltd.
AUDITORS: Deloitte & Touche LLP AUDITORS: BDO
CAPITAL STRUCTURE AUTHORISED ISSUED CAPITAL STRUCTURE AUTHORISED ISSUED
GLN Ords USD0.01c ea 50 000 000 000 13 300 000 000 GTC Ords no par val - 574 255 122
DISTRIBUTIONS [USDc] DISTRIBUTIONS [PLN]
Ords USD0.01c ea Ldt Pay Amt Ords no par val Ldt Pay Amt
Share Premium No 20 26 Aug 25 19 Sep 25 5.00 Final No 6 27 Aug 24 27 Sep 24 22.00
Share Premium No 19 25 Apr 25 4 Jun 25 5.00 Final No 5 11 Jul 23 15 Sep 23 23.00
LIQUIDITY: Apr25 Avg 20m shares p.w., R1 701.9m(7.8% p.a.) LIQUIDITY: Apr25 Avg 106 shares p.w., R3 286.9(-% p.a.)
INDM 40 Week MA GLENCORE REDS 40 Week MA GTCSA
10216 4529
8296 3865
6375 3201
4455 2537
2534 1873
2020 | 2021 | 2022 | 2023 | 2024 | 2020 | 2021 | 2022 | 2023 | 2024 |
FINANCIAL STATISTICS FINANCIAL STATISTICS
(USD million) Dec 24 Dec 23 Dec 22 Dec 21 Dec 20 (Amts in EUR’000) Sep 24 Dec 23 Dec 22 Dec 21 Dec 20
Final Final Final Final Final Quarterly Final Final Final Final
Turnover 230 944 217 829 255 984 203 751 142 338 Turnover 46 800 183 400 166 563 171 951 160 121
Op Inc 4 627 8 678 24 831 10 266 2 017 Op Inc 21 300 45 300 99 411 112 168 104 729
NetIntPd(Rcvd) 2 334 1 900 1 336 1 140 1 453 NetIntPd(Rcvd) 9 300 33 200 31 696 42 977 34 913
Minority Int - 1 060 - 1 070 - 809 - 625 - 2 043 Minority Int 500 1 900 1 350 1 085 - 672
Att Inc - 1 634 4 280 17 320 4 974 - 1 903 Att Inc 9 400 10 500 23 411 41 651 - 70 189
TotCompIncLoss - 2 673 2 948 15 723 4 391 - 4 831 TotCompIncLoss 4 700 20 600 48 098 23 746 - 81 293
Fixed Ass 50 206 39 233 39 564 43 159 47 110 Fixed Ass 15 100 16 000 11 141 7 834 7 785
Inv & Loans 3 586 3 389 3 110 5 147 4 775 Inv & Loans 2 338 000 2 273 400 2 243 663 2 240 660 2 125 128
Tot Curr Ass 55 922 58 612 66 783 56 455 43 212 Tot Curr Ass 132 000 162 300 163 203 249 771 313 164
Ord SH Int 40 669 43 580 49 410 39 931 37 637 Ord SH Int 1 104 100 1 101 900 1 112 909 1 100 566 957 610
Minority Int - 5 009 - 5 343 - 4 191 - 3 014 - 3 235 Minority Int 25 800 24 300 22 678 16 423 16 538
LT Liab 45 091 36 154 33 944 41 134 44 157 LT Liab 1 419 000 1 444 000 1 433 841 1 487 683 1 274 363
Tot Curr Liab 49 709 47 928 51 679 48 671 39 441 Tot Curr Liab 158 200 86 000 100 454 84 246 232 246
PER SHARE STATISTICS (cents per share) PER SHARE STATISTICS (cents per share)
HEPS-C (ZARc) 18.33 812.24 2 293.20 769.08 246.90 HEPS-C (ZARc) - - - - - 263.06
DPS (ZARc) 183.90 240.62 986.83 338.29 85.94 DPS (ZARc) - 99.73 103.89 101.08 -
NAV PS (ZARc) 5 654.64 5 904.94 5 970.11 4 366.47 3 790.46 NAV PS (ZARc) 3 689.66 3 881.73 3 538.79 4 093.29 3 532.21
3 Yr Beta 0.90 0.91 1.63 1.87 1.78 3 Yr Beta 0.01 - 0.18 - 0.52 - 0.59 - 0.28
Price High 11 697 12 433 12 259 8 225 4 928 Price High 4 000 2 000 2 000 2 900 3 999
Price Low 8 024 9 230 7 920 4 520 2 254 Price Low 3 000 2 000 2 000 2 000 1 999
Price Prd End 8 352 11 165 11 404 8 115 4 700 Price Prd End 3 000 2 000 2 000 2 000 2 900
RATIOS RATIOS
Ret on SH Fnd - 7.55 8.40 36.51 11.78 - 11.47 Ret on SH Fnd 3.50 1.10 2.18 3.83 - 7.27
Oper Pft Mgn 2.00 3.98 9.70 5.04 1.42 Oper Pft Mgn 45.51 24.70 59.68 65.23 65.41
D:E 1.62 1.23 0.97 1.33 1.52 D:E 1.36 1.32 0.26 0.25 0.41
Current Ratio 1.12 1.22 1.29 1.16 1.10 Current Ratio 0.83 1.89 1.62 2.96 1.35
Div Cover - 1.30 2.61 2.21 1.66 - 2.76 Div Cover - 0.40 0.66 1.56 -
120