
Page 111 - Profile's Stock Exchange Handbook - 2025 Issue 2
P. 111
Profile’s Stock Exchange Handbook: 2025 – Issue 2 JSE – EAS
Eastern Platinum Ltd. Efora Energy Ltd.
EAS EFO
ISIN: CA2768555096 SHORT: EASTPLATS CODE: EPS ISIN: ZAE000248258 SHORT: EFORA CODE: EEL
REG NO: 2007/006318/10 FOUNDED: 2005 LISTED: 2007 REG NO: 1993/000460/06 FOUNDED: 1993 LISTED: 1994
NATURE OF BUSINESS: With its head office in Vancouver, Eastplats has a NATURE OF BUSINESS: Efora Energy Ltd. is a South African based
primary listingonthe TorontoStock Exchange (TSX:ELR)andasecondary independent African oil and gas company, listed on the JSE. The Company
listing on the Johannesburg Stock Exchange (JSE:EPS). Formed in 2003, has a diverse portfolio of assets spanning production in Egypt; exploration
Eastplats has acquired a portfolio of high-grade platinum, palladium and and appraisal in the Democratic Republic of Congo; midstream project
rhodium-rich deposits. Eastplats is a responsible, value-driven and relatingtocrudeoiltradinginNigeriaandmaterialdownstreamdistribution
innovative PGM and chrome mining and exploration group. Eastplatsaims operations throughout southern Africa. The Group’s focus is on delivering
to create value for all stakeholders through its exceptional assets. energy for the African continent by using Africa’s own resources to meet the
SECTOR:BasicMaterials—BasicResrcs—PreciousMet&Min—Plat&PrecMet significant growth in demand expected over the next decade.
NUMBER OF EMPLOYEES: 0 SECTOR: Energy—Energy—OilGas&Coal—IntegratedOil&Gas
DIRECTORS: Guan X (ne, China), Liu C (ind ne), Ng L (ind ne), Shi Dr B (ne), NUMBER OF EMPLOYEES: 113
Yang W(CEO),HuiW(CFO) DIRECTORS: Mngconkola P (ld ind ne), Radebe Z (ind ne),
POSTAL ADDRESS: 1080 - 1188 West Georgia Street, Vancouver, Tonjeni M (ind ne), Arendse D (Interim CEO), Ngonyama V (Chair, ind ne)
British Columbia POSTAL ADDRESS:PostnetSuite211, PrivateBagX75,Bryanston,2021
MORE INFO: www.sharedata.co.za/sdo/jse/EPS MORE INFO: www.sharedata.co.za/sdo/jse/EEL
COMPANY SECRETARY: Rowland Wallenius COMPANY SECRETARY: FusionCorporateSecretarialServices(Pty)Ltd.
TRANSFER SECRETARY: JSE Investor Services (Pty) Ltd. TRANSFER SECRETARY: JSE Investor Services (Pty) Ltd.
SPONSOR: PSG Capital Ltd. SPONSOR: PSG Capital Ltd.
AUDITORS: Davidson & Company LLP AUDITORS: SizweNtsalubaGobodo Grant Thornton Inc.
CAPITAL STRUCTURE AUTHORISED ISSUED CAPITAL STRUCTURE AUTHORISED ISSUED
EPS Ords no par value - 202 491 426 EEL Ords no par value 10 000 000 000 1 103 834 635
LIQUIDITY: Apr25 Avg 28 547 shares p.w., R47 923.4(0.7% p.a.) LIQUIDITY: Apr25 Avg 337 208 shares p.w., R18 818.3(1.6% p.a.)
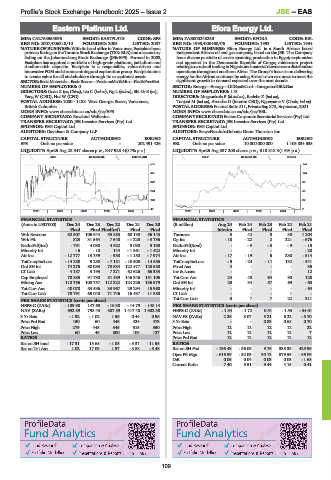
MINI 40 Week MA EASTPLATS OILP 40 Week MA EFORA
515 154
421 124
327 93
234 63
140 32
46 2
2020 | 2021 | 2022 | 2023 | 2024 | 2020 | 2021 | 2022 | 2023 | 2024 |
FINANCIAL STATISTICS FINANCIAL STATISTICS
(Amts in USD’000) Dec 24 Dec 23 Dec 22 Dec 21 Dec 20 (R million) Aug 24 Feb 24 Feb 23 Feb 22 Feb 21
Final Final Final(rst) Final Final Interim Final Final Final Final
Wrk Revenue 62 507 106 944 53 883 68 198 56 143 Turnover 3 42 8 38 1 204
Wrk Pft 823 31 564 7 640 - 1 225 - 3 736 Op Inc - 18 - 22 2 221 - 676
NetIntPd(Rcd) - 791 4 088 4 622 5 090 5 190 NetIntPd(Rcvd) - -3 -3 -9 -15
Minority Int - 6 - 10 144 - 1 561 - 1 422 Minority Int - - - - - 28
Att Inc - 12 777 13 759 - 938 - 1 150 - 7 974 Att Inc - 17 - 19 6 230 - 514
TotCompIncLoss - 14 238 9 280 - 7 181 - 10 508 - 14 556 TotCompIncLoss - 9 - 24 - 11 132 - 541
Ord SH Int 74 276 88 083 73 634 122 477 125 580 Fixed Ass 4 - - - 35
LT Liab 4 187 3 193 7 271 62 626 66 333 Inv & Loans - - - - 12
Cap Employed 78 885 91 730 81 439 146 346 151 105 Tot Curr Ass 24 40 64 90 128
Mining Ass 110 756 100 757 112 222 124 226 136 579 Ord SH Int 25 34 57 69 - 63
Tot Curr Ass 40 078 53 536 33 967 29 294 15 960 Minority Int - - - - - 64
Tot Curr Liab 78 791 69 040 71 746 16 437 11 880 LT Liab - - - 1 -
PER SHARE STATISTICS (cents per share) Tot Curr Liab 3 7 7 22 311
HEPS-C (ZARc) - 109.98 147.68 - 16.38 - 14.79 - 148.14 PER SHARE STATISTICS (cents per share)
NAV (ZARc) 692.89 798.43 887.59 1 417.48 1 902.30 HEPS-C (ZARc) - 1.54 - 1.72 0.51 - 1.53 - 34.01
3 Yr Beta - 1.92 - 1.02 1.55 0.44 0.96 NAV PS (ZARc) 2.26 3.07 5.21 6.22 - 5.70
Price Prd End 150 60 448 424 473 3 Yr Beta - - 0.83 0.68 0.70
Price High 279 448 545 515 550 Price High 12 12 12 12 22
Price Low 60 46 300 108 127 Price Low 12 12 12 12 7
RATIOS Price Prd End 12 12 12 12 12
Ret on SH fund - 17.31 15.68 - 1.08 - 3.37 - 11.55 RATIOS
Ret on Tot Ass 1.02 17.09 1.97 - 3.88 - 5.48 Ret on SH Fnd - 136.48 - 56.05 9.76 335.35 425.96
Oper Pft Mgn - 616.59 - 52.03 30.13 579.59 - 56.09
D:E 0.05 0.04 0.03 0.03 - 1.65
Current Ratio 7.40 5.51 9.44 4.15 0.41
109