
Page 66 - Profile's Stock Exchange Handbook - 2025 Issue 1
P. 66
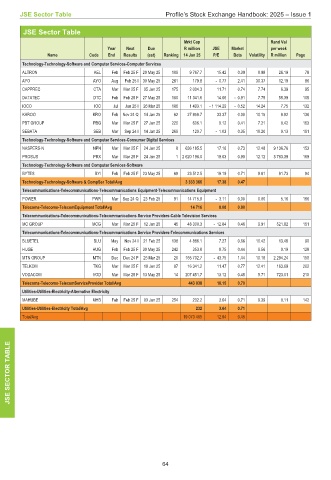
JSE Sector Table                         Profile’s Stock Exchange Handbook: 2025 – Issue 1

        JSE Sector Table
                                                     Mrkt Cap                 Rand Val
                                Year  Next  Due      R million  JSE  Market   per week
               Name       Code  End  Results  (est)  Ranking  14 Jan 25  P/E  Beta  Volatility  R million  Page
       Technology-Technology-Software and Computer Services-Computer Services
       ALTRON               AEL  Feb  Feb 25 F 20 May 25  109  9 767.7  15.42  0.39  8.98  26.19  78
       AYO                 AYO   Aug  Feb 25 I 30 May 25  261  179.8  - 0.77  2.41  30.37  12.19  86
       CAPPREC              CTA  Mar  Mar 25 F  05 Jun 25  175  2 004.3  11.71  0.74  7.74  6.39  95
       DATATEC              DTC  Feb  Feb 25 F 27 May 25  100  11 341.6  14.06  - 0.91  7.79  55.39  105
       IOCO                 IOC  Jul  Jan 25 I  26 Mar 25  186  1 493.1  - 1 114.29  - 0.52  14.24  7.75  132
       KAROO               KRO   Feb Nov 24 Q  14 Jan 25  62  27 958.7  33.37  0.00  10.15  8.92  136
       PBT GROUP           PBG   Mar  Mar 25 F  27 Jun 25  220  606.1  9.12  0.41  7.21  0.42  163
       SEBATA               SEB  Mar  Sep 24 I  14 Jan 25  269  120.7  - 1.03  0.35  18.20  0.13  191
       Technology-Technology-Software and Computer Services-Consumer Digital Services
       NASPERS-N           NPN   Mar  Mar 25 F  24 Jun 25  8  636 185.5  17.16  0.73  12.48  9 136.76  153
       PROSUS               PRX  Mar  Mar 25 F  24 Jun 25  1 2 620 196.0  19.03  0.90  12.12  3 783.39  169
       Technology-Technology-Software and Computer Services-Software
       BYTES                BYI  Feb  Feb 25 F 23 May 25  69  23 512.5  19.19  0.71  9.81  91.73  94
       Technology-Technology-Software & CompSer Total/Avg  3 333 366  17.38  0.47
       Telecommunications-Telecommunications-Telecommunications Equipment-Telecommunications Equipment

       POWER               PWR   Mar Sep 24 Q  23 Feb 25  91  14 715.9  - 3.11  0.00  0.00  5.16  166
       Telecoms-Telecoms-TelecomEquipment Total/Avg    14 716  0.00  0.00
       Telecommunications-Telecommunications-Telecommunications Service Providers-Cable Television Services
       MC GROUP            MCG   Mar  Mar 25 F  12 Jun 25  45  48 300.3  - 12.84  0.46  9.91  521.82  151
       Telecommunications-Telecommunications-Telecommunications Service Providers-Telecommunications Services
       BLUETEL              BLU  May  Nov 24 I  21 Feb 25  138  4 888.1  7.27  0.66  10.42  13.48  90
       HUGE                HUG   Feb  Feb 25 F 30 May 25  242  353.8  8.75  0.44  9.56  0.19  128
       MTN GROUP           MTN   Dec  Dec 24 F  25 Mar 25  20  165 702.7  - 43.75  1.44  10.18  2 294.24  150
       TELKOM               TKG  Mar  Mar 25 F  18 Jun 25  87  16 341.2  11.47  0.77  12.41  163.69  202
       VODACOM             VOD   Mar  Mar 25 F 13 May 25  14  207 451.7  13.12  0.45  5.71  723.01  210
       Telecoms-Telecoms-TelecomServiceProvider Total/Avg  443 038  10.15  0.70
       Utilities-Utilities-Electricity-Alternative Electricity
       MAHUBE              MHB   Feb  Feb 25 F  03 Jun 25  254  232.2  3.64  0.71  9.39  0.11  142
       Utilities-Utilities-Electricity Total/Avg         232   3.64  0.71
       Total/Avg                                     19 073 405  12.94  0.45


    TABLE


    SECTOR


    JSE


                                               64