
Page 65 - Profile's Stock Exchange Handbook -2024 Issue 4
P. 65
Profile’s Stock Exchange Handbook: 2024 – Issue 4 JSE Sector Table
JSE Sector Table
Mrkt Cap Rand Val
Year Next Due R million JSE Market per week
Name Code End Results (est) Ranking 30 Oct 24 P/E Beta Volatility R million Page
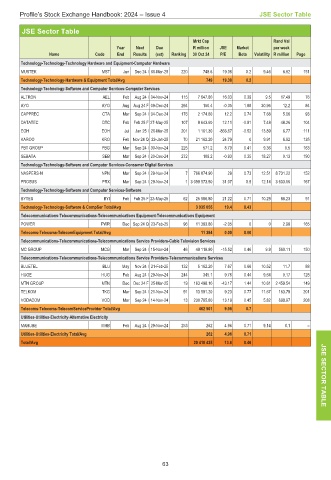
Technology-Technology-Technology Hardware and Equipment-Computer Hardware
MUSTEK MST Jun Dec 24 I 06-Mar-25 220 748.6 19.38 0.2 9.46 6.92 151
Technology-Technology-Hardware & Equipment Total/Avg 749 19.38 0.2
Technology-Technology-Software and Computer Services-Computer Services
ALTRON AEL Feb Aug 24 I 04-Nov-24 115 7 647.80 16.03 0.39 9.5 17.49 76
AYO AYO Aug Aug 24 F 09-Dec-24 264 150.4 -0.35 1.88 30.95 12.2 84
CAPPREC CTA Mar Sep 24 I 04-Dec-24 176 2 174.60 12.2 0.74 7.68 5.06 93
DATATEC DTC Feb Feb 25 F 27-May-25 107 9 643.60 12.11 -0.91 7.48 48.26 104
EOH EOH Jul Jan 25 I 26-Mar-25 201 1 161.30 -866.67 -0.52 13.89 6.77 111
KAROO KRO Feb Nov 24 Q 23-Jan-25 70 21 162.20 24.79 0 9.91 6.92 135
PBT GROUP PBG Mar Sep 24 I 30-Nov-24 225 571.2 8.79 0.41 9.36 0.5 163
SEBATA SEB Mar Sep 24 I 20-Dec-24 272 109.2 -0.93 0.35 18.27 0.13 190
Technology-Technology-Software and Computer Services-Consumer Digital Services
NASPERS-N NPN Mar Sep 24 I 29-Nov-24 7 766 874.90 29 0.73 12.51 8 731.22 152
PROSUS PRX Mar Sep 24 I 29-Nov-24 1 3 099 573.50 31.07 0.9 12.14 3 633.66 167
Technology-Technology-Software and Computer Services-Software
BYTES BYI Feb Feb 25 F 23-May-25 62 25 986.80 21.22 0.71 10.29 88.23 91
Technology-Technology-Software & CompSer Total/Avg 3 935 055 19.4 0.43
Telecommunications-Telecommunications-Telecommunications Equipment-Telecommunications Equipment
POWER PWR Dec Sep 24 Q 23-Feb-25 96 11 383.80 -2.05 0 0 2.98 165
Telecoms-Telecoms-TelecomEquipment Total/Avg 11 384 0.00 0.00
Telecommunications-Telecommunications-Telecommunications Service Providers-Cable Television Services
MC GROUP MCG Mar Sep 24 I 15-Nov-24 46 49 118.90 -15.52 0.46 9.9 560.11 150
Telecommunications-Telecommunications-Telecommunications Service Providers-Telecommunications Services
BLUETEL BLU May Nov 24 I 21-Feb-25 132 5 162.20 7.67 0.66 10.52 11.7 88
HUGE HUG Feb Aug 24 I 29-Nov-24 244 345.1 9.76 0.44 9.64 0.17 128
MTN GROUP MTN Dec Dec 24 F 25-Mar-25 19 163 498.10 -43.17 1.44 10.61 2 459.54 149
TELKOM TKG Mar Sep 24 I 21-Nov-24 91 13 591.20 9.23 0.77 11.67 163.79 201
VODACOM VOD Mar Sep 24 I 14-Nov-24 13 230 785.80 13.19 0.45 5.82 699.97 208
Telecoms-Telecoms-TelecomServiceProvider Total/Avg 462 501 9.96 0.7
Utilities-Utilities-Electricity-Alternative Electricity
MAHUBE MHB Feb Aug 24 I 29-Nov-24 253 262 4.96 0.71 9.14 0.1 –
Utilities-Utilities-Electricity Total/Avg 262 4.96 0.71
Total/Avg 20 418 435 13.6 0.46 JSE
SECTOR
TABLE
63