
Page 179 - Profile's Stock Exchange Handbook - 2026 Issue 1
P. 179
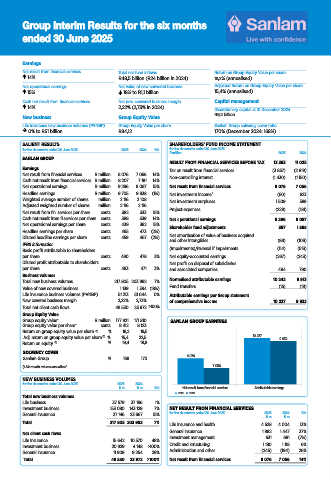
Group Interim Results for the six months
ended 30 June 2025
Earnings
Net result from financial services Total net fund inflows Return on Group Equity Value per share
14% R48,5 billion (R24 billion in 2024) 18,2% (annualised)
Net operational earnings Net value of new convered business Adjusted Return on Group Equity Value per share
15% 18% to R1,1 billion 15,4% (annualised)
Cash net result from financial services Net new convered business margin Capital management
14% 2,22% (2,73% in 2024)
Discretionary capital at 31 December 2024
New business Group Equity Value R9,2 billion
Life insurance new business volumes (PVNBP) Group Equity Value per share Sanlam Group solvency cover ratio
0% to R51 billion R84,12 170% (December 2024: 168%)
SALIENT RESULTS SHAREHOLDERS’ FUND INCOME STATEMENT
for the six months ended 30 June 2025 2025 2024 % for the six months ended 30 June 2025
R’million 2025 2024
SANLAM GROUP
RESULT FROM FINANCIAL SERVICES BEFORE TAX 13 363 11 025
Earnings Tax on result from financial services (3 857) (2 819)
Net result from financial services R million 8 076 7 056 14% Non-controlling interest (1 430) (1 150)
Cash net result from financial services R million 8 207 7 181 14%
Net operational earnings R million 9 296 8 087 15% Net result from financial services 8 076 7 056
Headline earnings R million 9 705 9 838 (1%) Net investment income` (60) 623
Weighted average number of shares million 2 116 2 108 Net investment surpluses 1 509 589
Adjusted weighted number of shares million 2 116 2 116
Net result from fin. services per share cents 382 333 15% Project expenses (229) (181)
Cash net result from fi.services per share cents 388 339 14% Net operational earnings 9 296 8 087
Net operational earnings per share cents 439 382 15% Shareholder fund adjustments 397 1 898
Headline earnings per share cents 465 473 (2%)
Diluted headline earnings per share cents 459 467 (2%) Net amortisation of value of business acquired
IFRS information and other intangibles (88) (106)
Basic profit attributable to shareholders (Impairments)/reversal if impairments (114) (513)
per share cents 490 478 3% Net equity-accounted earnings (267) (243)
Diluted profit attributable to shareholders Net profit on disposal of subsidiaries
per share cents 483 471 3% and associated companies 484 790
Business volumes
Total new business volumes 217 805 203 992 7% Normalised attributable earnings 10 242 9 913
Value of new covered business 1 139 1 394 (18%) Fund transfers (15) (19)
Life insurance business volumes (PVNBP) 51 213 51 044 0% Attributable earnings per Group statement
New covered business margin 2,22% 2,73% of comprehensive income 10 227 9 932
Total net client cash flows 48 530 23 972 >100%
Group Equity Value
Group equity value* R million 177 921 171 810 SANLAM GROUP EARNINGS
Group equity value per share* cents 8 412 8 123
Return on group equity value per share (1) % 18,2 19,5
(1)
Adj. return on group equity value per share % 15,4 22,5 10 227 9 932
Return on equity (1) % 19,4 18,8
SOLVENCY COVER
Sanlam Group % 168 170 8 076
1) Six-month returns annualised 7 056
NEW BUSINESS VOLUMES
for the six months ended 30 June 2025 2025 2024
R’m R’m % Net result from financial services Attributable earnings
2025 2024
Total new business volumes
Life business 37 579 37 196 1%
Investment business 153 080 143 129 7% NET RESULT FROM FINANCIAL SERVICES 2025 2024
for the six months ended 30 June 2025
General insurance 27 146 23 667 15% R’m R’m %
Total 217 805 203 992 7% Life insurance and health 4 528 4 004 13%
General insurance 1 982 1 447 37%
Net client cash fl ows Investment management 631 681 (7%)
Life insurance 15 642 10 570 48%
Investment business 20 929 4 148 >100% Credit and structuring 1 180 1 118 6%
General insurance 11 909 9 254 29% Administration and other (245) (194) 26%
Total 48 530 23 972 >100% Net result from financial services 8 076 7 056 14%
26/10/2025 20:50:30
JSE R&E book IR2025 v20251021.indd 1 26/10/2025 20:50:30
JSE R&E book IR2025 v20251021.indd 1