
Page 178 - Profile's Stock Exchange Handbook - 2026 Issue 1
P. 178
JSE - SAN Profile’s Stock Exchange Handbook: 2026 - Issue 1
Sanlam Ltd. NUMBER OF EMPLOYEES: 23 926
DIRECTORS: Birrell A S (ind ne), Botha A D
(ne), Essoka E (ind ne), Kruger N A S (ind ne),
Manyonga N (ind ne), Masilela E (ind ne),
Mokoka M G (ind ne), Moller J P (ind ne),
Nkosi S A (ne), Nondumo K T (ind ne),
van Biljon W (ind ne), van Zyl Dr J (ne),
Zinn S A (ind ne), Mvusi T I (Chair, ind ne),
Motsepe Dr P T (Dep Chair, ne), Hanratty P B
Scan the QR code to (CEO), Mukhuba A (FD)
visit our website POSTAL ADDRESS: PO Box 1, Sanlamhof, 7532
EMAIL: ir@sanlam.co.za
ISIN: ZAE000070660 SHORT: SANLAM CODE: SLM WEBSITE: www.sanlam.com
REG NO: 1959/001562/06 FOUNDED: 1918 LISTED: 1998 TELEPHONE: 002786-072-6526
NATURE OF BUSINESS: COMPANY SECRETARY: Adela Fortune
TRANSFER SECRETARY: Computershare Investor Services (Pty) Ltd.
Sanlam is a leading financial services group delivering SPONSOR: Standard Bank of South Africa Ltd.
long-term growth through its operations in high-potential AUDITORS: KPMG Inc., PwC Inc.
emerging markets. With a history spanning over a century, BANKERS: Absa Bank Ltd.
Sanlam is driven by its purpose to empower generations CALENDAR Expected Status
to be financially confident, secure and prosperous. Next Final Results Mar 2026 Unconfirmed
Sanlam’s solutions, delivered through its clusters, create a Annual General Meeting Jun 2026 Unconfirmed
Next Interim Results
Unconfirmed
Sep 2026
unique ecosystem that enables Sanlam to serve its clients’
financial services needs over their lifetimes. CAPITAL STRUCTURE Authorised Issued
With a presence in 30 countries, Sanlam is focused on SLM Ords 1c ea 4 000 000 000 2 117 153 949
high-potential emerging markets in Africa and Asia that DISTRIBUTIONS [ZARc]
Pay
Ldt
Amt
have attractive structural drivers for long-term growth, Ords 1c ea 1 Apr 25 7 Apr 25 445.00
Final No 27
accelerated financial inclusion and shared value creation. Final No 26 2 Apr 24 8 Apr 24 400.00
Sanlam’s diversified geographic scope and market- Final No 25 3 Apr 23 11 Apr 23 360.00
leading positions across South Africa, Pan-Africa and Asia, Final No 24 5 Apr 22 11 Apr 22 334.00
alongside our strategic partners in each region, provide LIQUIDITY: Dec25 Avg 21m shares p.w., R1 782.5m(50.9% p.a.)
compelling near- to long-term opportunities to capture
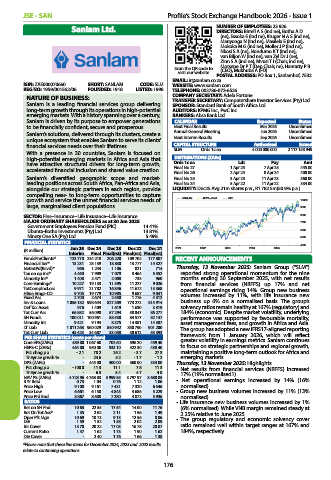
growth and service the unmet financial services needs of SANLAM 40 Week MA LIFE 10000
large, marginalised client populations. 9000
SECTOR: Fins--Insurance--Life Insurance--Life Insurance 8000
MAJOR ORDINARY SHAREHOLDERS as at 30 Jun 2025 7000
Government Employees Pension Fund (PIC) 14.41%
Ubuntu-Botho Investments (Pty) Ltd. 13.81% 6000
Ninety One SA (Pty) Ltd. 5.49%
5000
FINANCIAL STATISTICS
Jun 25 Dec 24 Dec 23 Dec 22 Dec 21 2021 2022 2023 2024 2025 4000
(R million)
Interim Final Final(rst) Final(rst) Final(rst)
FundsFmClients* 123 770 234 218 206 220 109 702 177 807 RECENT ANNOUNCEMENTS
Financial Ser* 13 231 25 139 18 830 13 777 14 327
NetIntPd(Rcvd)* 966 1 243 1 106 821 714 Thursday, 13 November 2025: Sanlam Group (“SLM”)
Tax on op inc* 4 460 7 909 7 079 3 464 5 352 reported strong operational momentum for the nine
Minority Int* 1 408 2 471 2 008 733 960 months ending 30 September 2025, with net results
Core Earnings* 10 227 19 133 11 595 11 227 9 026 from financial services (NRFFS) up 17% and net
TotCompIncLoss 9 971 21 782 16 846 11 672 13 368 operational earnings rising 14%. Group new business
Hline Erngs-CO 9 705 19 779 10 985 9 687 9 041 volumes increased by 11%, with life insurance new
Fixed Ass 2 700 2 674 2 550 1 776 4 312
Inv & Loans 1 056 182 998 644 827 309 773 272 815 914 business up 6% on a normalised basis. The group’s
Def Tax Asset 976 1 409 1 619 1 630 3 319 solvency ratios remain healthy at 167% (regulatory) and
Tot Curr Ass 66 852 56 090 57 294 58 047 86 277 184% (economic). Despite market volatility, underlying
SH Funds 100 011 100 961 88 530 84 577 82 147 performance was supported by favourable mortality,
Minority Int 9 421 9 194 8 375 14 381 14 387 asset management fees, and growth in Africa and Asia.
LT Liab 1 011 268 960 029 840 942 850 790 901 200 The group has adopted a new IFRS17-aligned reporting
Tot Curr Liab 45 423 34 687 33 038 30 612 53 393 framework from 1 January 2026, which will reflect
PER SHARE STATISTICS (cents per share)
Core EPS(ZARc) 489.80 1 067.60 702.60 598.20 459.40 greater volatility in earnings metrics. Sanlam continues
HEPS-C (ZARc) 464.80 950.00 533.10 422.30 438.40 to focus on strategic partnerships and regional growth,
Pct chng p.a. - 2.1 78.2 26.2 - 3.7 27.3 maintaining a positive long-term outlook for Africa and
Tr 5yr av grwth % - 24.6 5.2 - 1.7 - 1.2 emerging markets.
DPS (ZARc) - 445.00 400.00 360.00 334.00 Thursday, 13 November 2025: Highlights
Pct chng p.a. - 100.0 11.3 11.1 7.8 11.3 • Net results from financial services (NRFFS) increased
Tr 5yr av grwth % - 6.3 5.4 4.7 4.8 17% (19% normalised1).
NAV PS (ZARc) 4 723.96 4 768.83 3 999.55 3 797.97 3 688.85
3 Yr Beta 0.73 1.04 0.76 1.12 1.06 • Net operational earnings increased by 14% (16%
Price High 9 108 9 161 7 431 7 320 6 546 normalised).
Price Low 6 661 6 150 4 843 4 686 5 229 • Group new business volumes increased by 11% (13%
Price Prd End 8 867 8 688 7 280 4 872 5 936 normalised).
RATIOS • Life insurance new business volumes increased by 1%
Ret on SH Fnd 10.63 22.55 17.54 14.00 11.76 (6% normalised). While VNB margin remained steady at
Ret On Tot Ass* 1.35 2.62 2.11 1.56 1.49 2.25% relative to June 2025.
Oper Pft Mgn 10.69 10.73 9.13 12.56 8.06 • The group regulatory and economic solvency cover
D:E 1.59 1.52 1.58 2.02 2.09
Int Cover 13.70 20.22 17.03 16.78 20.07 ratio remained well within target ranges at 167% and
Current Ratio 1.47 1.62 1.73 1.90 1.62 184%, respectively.
Div Cover - 2.40 1.76 1.66 1.38
*Please note that these line items for December 2024, 2023 and 2022 results
relate to continuing operations
176