
Page 149 - Profile's Stock Exchange Handbook - 2026 Issue 1
P. 149
Profile’s Stock Exchange Handbook: 2026 - Issue 1 JSE - NEP
NEPI Rockcastle NV Netcare Ltd.
ISIN: NL0015000RT3 SHORT: NEPIROCK CODE: NRP ISIN: ZAE000011953 SHORT: NETCARE CODE: NTC
REG NO: 014178V FOUNDED: 2016 LISTED: 2017 ISIN: ZAE000081121 SHORT: NTC PREF CODE: NTCP
NATURE OF BUSINESS: NEPI Rockcastle is the premier owner REG NO: 1996/008242/06 FOUNDED: 1996 LISTED: 1996
and operator of shopping centres in Central and Eastern Europe NATURE OF BUSINESS: The Netcare Group is a leading provider of
(‘CEE’), with a presence in eight countries and an investment private healthcare services in South Africa (SA). Netcare provides
portfolio of EUR7.9 billion. The Group benefits from a highly-skilled acute services across its national network of hospitals and are
internal management team which combines asset management, the market leader in acute mental health services. Netcare also
development, investment, leasing and financial expertise. provides emergency, cancer care, diagnostics support, primary
Geographically diverse management skills allow NEPI Rockcastle care and renal care services as well as occupational health and
to pursue CEE property opportunities efficiently, benefiting wellness services. Netcare improves access to affordable services
from a strategic advantage in the acquisition, development and and high-quality healthcare through NetcarePlus. Netcare
management of properties. Education develops healthcare professionals in nursing and
SECTOR: RealEstate--RealEstate--InvestmentServices--Holdings emergency medical services.
NUMBER OF EMPLOYEES: 650 SECTOR: HlthCare--HtlhCare--HlthCarePrvdrs--HlthCareFacilities
DIRECTORS: Brown S (ne), de Lange A (ind ne), Dijkstra A L V NUMBER OF EMPLOYEES: 18 350
(ind ne, Dutch), Holscher J (ind ne), Klingen A (ld ind ne), Lurie J (ind ne), DIRECTORS: Human L (ind ne), Kirk I M (ind ne, Ireland), Mathe B (ind ne),
Majija S V (alt), Mihaescu A M (ind ne), van der Veer A (ind ne), Aase G Phillips Dr R (ind ne), Stephens L (ind ne), Maditse A K (Chair, ld ind ne),
(Chair, ind ne), Dany R (CEO), Noetzel M P (COO, Polish), Predoiu E (CFO) Friedland Dr R H (CEO), Gibson K N (Group CFO)
MAJOR ORDINARY SHAREHOLDERS as at 30 Jul 2025 MAJOR ORDINARY SHAREHOLDERS as at 2 Jul 2025
Fortress Real Estate Investments Ltd. 16.26% Public Investment Corporation Ltd. 19.67%
Public Investment Corporation 13.84% Fairtree Asset Management (Pty) Ltd. 7.55%
State Street Bank and Trust 7.51% Templeton Asset Management Ltd. 6.58%
POSTAL ADDRESS: WTC Zuidas, Tower 10, 5th Floor, Strawinskylaan 563, POSTAL ADDRESS: Private Bag X34, Benmore, 2010
Amsterdam, 1077XX MORE INFO: www.sharedata.co.za/sdo/jse/NTC
MORE INFO: www.sharedata.co.za/sdo/jse/NRP COMPANY SECRETARY: Charles Vikisi
COMPANY SECRETARY: Alex Florescu TRANSFER SECRETARY: CTSE Registry Services (Pty) Ltd.
TRANSFER SECRETARY: Computershare Investor Services (Pty) Ltd. SPONSOR: Nedbank Corporate and Investment Banking
SPONSOR: Java Capital (Pty) Ltd. AUDITORS: Deloitte & Touche Inc.
AUDITORS: Ernst & Young Inc. CAPITAL STRUCTURE Authorised Issued
CAPITAL STRUCTURE Authorised Issued NTC Ords 1c ea 2 500 000 000 1 364 628 089
NRP Ords EUR1c ea 2 600 000 000 712 357 309 NTCP Prefs 50c ea 10 000 000 6 500 000
DISTRIBUTIONS [EURc] DISTRIBUTIONS [ZARc]
Ords EUR1c ea Ldt Pay Amt Ords 1c ea Ldt Pay Amt
Interim No 16 9 Sep 25 9 Oct 25 27.95 Final No 30 20 Jan 26 26 Jan 26 49.00
Final No 15 17 Mar 25 11 Apr 25 27.05 Interim No 29 8 Jul 25 14 Jul 25 36.00
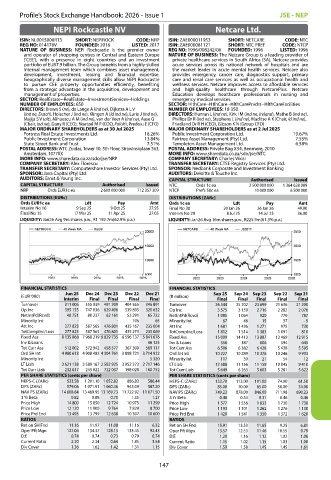
LIQUIDITY: Jan26 Avg 9m shares p.w., R1 192.7m(62.9% p.a.) LIQUIDITY: Jan26 Avg 16m shares p.w., R225.9m(61.3% p.a.)
FINANCIAL STATISTICS FINANCIAL STATISTICS
Jun 25 Dec 24 Dec 23 Dec 22 Dec 21 Sep 25 Sep 24 Sep 23 Sep 22 Sep 21
(EUR ‘000) (R million)
Interim Final Final Final Final Final Final Final Final Final
Turnover 311 006 555 939 491 209 404 565 346 891 Turnover 26 344 25 202 23 699 21 636 21 200
Op Inc 395 155 747 036 629 496 539 895 320 632 Op Inc 3 575 3 159 2 716 2 282 2 076
NetIntPd(Rcvd) 48 751 80 237 62 161 53 291 65 722 NetIntPd(Rcvd) 1 085 1 064 920 770 787
Minority Int - - - 106 65 Minority Int 67 48 15 37 - 9
Att Inc 277 823 587 565 476 801 435 167 235 004 Att Inc 1 681 1 436 1 271 975 730
TotCompInc/Loss 277 823 587 565 476 801 435 273 235 069 TotCompInc/Loss 1 812 1 514 1 383 1 091 810
Fixed Ass 8 135 868 7 968 219 6 829 735 6 596 137 5 841 676 Fixed Ass 15 009 14 413 13 887 13 469 12 915
Inv & Loans - - - - 46 125 Inv & Loans 356 387 606 594 643
Tot Curr Ass 512 002 572 942 458 577 367 300 569 117 Tot Curr Ass 6 506 6 382 6 428 5 438 5 595
Ord SH Int 4 980 613 4 908 482 4 304 761 3 898 721 3 714 922 Ord SH Int 10 227 10 289 10 376 10 246 9 933
Minority Int - - - - 5 320 Minority Int 117 39 21 54 12
LT Liab 3 621 138 3 589 167 2 582 925 3 052 373 2 717 146 LT Liab 12 588 11 156 11 159 10 045 9 410
Tot Curr Liab 232 617 245 022 722 037 198 028 160 752 Tot Curr Liab 5 649 6 263 5 603 5 281 5 622
PER SHARE STATISTICS (cents per share) PER SHARE STATISTICS (cents per share)
HEPS-C (ZARc) 533.58 1 201.10 1 052.82 886.83 586.44 HEPS-C (ZARc) 133.70 113.00 101.00 74.00 61.50
DPS (ZARc) 579.06 1 071.91 1 060.46 943.09 587.20 DPS (ZARc) 85.00 70.00 65.00 50.00 34.00
NAV PS (ZARc) 14 608.84 13 469.95 13 169.73 11 722.92 11 071.50 NAV PS (ZARc) 749.23 878.00 846.00 711.98 690.23
3 Yr Beta 0.82 0.88 0.70 1.35 1.27 3 Yr Beta 0.48 0.54 0.31 0.46 0.46
Price High 14 800 15 050 12 724 10 975 11 299 Price High 1 577 1 556 1 633 1 730 1 738
Price Low 12 120 11 900 9 764 7 829 8 700 Price Low 1 193 1 101 1 262 1 276 1 130
Price Prd End 13 495 13 799 12 638 10 307 10 600 Price Prd End 1 420 1 541 1 350 1 372 1 620
RATIOS RATIOS
Ret on SH Fnd 11.16 11.97 11.08 11.16 6.32 Ret on SH Fnd 15.91 13.53 11.65 9.25 6.81
Oper Pft Mgn 127.06 134.37 128.15 133.45 92.43 Oper Pft Mgn 13.57 12.53 11.46 10.55 9.79
D:E 0.74 0.74 0.73 0.79 0.74 D:E 1.20 1.16 1.12 1.02 1.06
Current Ratio 2.20 2.34 0.64 1.85 3.54 Current Ratio 1.15 1.02 1.15 1.03 1.00
Div Cover 1.36 1.62 1.42 1.31 1.15 Div Cover 1.59 1.58 1.45 1.45 1.61
147