
Page 148 - Profile's Stock Exchange Handbook - 2026 Issue 1
P. 148
JSE - NAS Profile’s Stock Exchange Handbook: 2026 - Issue 1
Naspers Ltd. Nedbank Group Ltd.
ISIN: ZAE000351946 SHORT: NASPERS-N CODE: NPN ISIN: ZAE000004875 SHORT: NEDBANK
REG NO: 1925/001431/06 FOUNDED: 1925 LISTED: 1994 CODE: NED REG NO: 1966/010630/06
NATURE OF BUSINESS: Established in 1915, Naspers has FOUNDED: 1888 LISTED: 1969
transformed itself to become a global consumer internet company NATURE OF BUSINESS: Nedbank Group, with
and one of the largest technology investors in the world. Through assets of more than R1.3tn, is one of the
Prosus, the group operates and invests globally in markets with largest financial services groups in Africa,
long-term growth potential, building leading consumer internet offering wholesale and retail banking, as
companies that empower people and enrich communities. Prosus well as insurance, asset management and
wealth management services and solutions
has its primary listing on Euronext Amsterdam, and a secondary to more than 7.3 million active clients. The group’s ordinary shares
listing on the Johannesburg Stock Exchange and Naspers is the have been listed on the JSE since 1969. In South Africa (SA), Nedbank
majority owner of Prosus. has a strong franchise that contributes 90% of the group’s R1.3tn in
SECTOR: Technology--Technology--Software & CompSer--DigitalService assets and 80% of the group’s R15.7bn headline earnings (HE).
NUMBER OF EMPLOYEES: 33 246 SECTOR: Fins--Banks--Banks--Banks
DIRECTORS: Dubey S (ind ne), Kemna A (ind ne), Mahanyele- Dabengwa P, NUMBER OF EMPLOYEES: 25 613 (permanent)
Bloisi F (CEO), Marais N (CFO), Bekker J P (Chair, ne), du Toit H J (ld ind ne), DIRECTORS: Bomela M S (ind ne), Fortuin O D (ind ne), Grobler F (ind ne),
Enenstein C (ind ne), Girotra M (ind ne, India), Jafta Prof R C C (ind ne), Hermanus Dr M (ind ne), Njenga G (ind ne), Nombembe T (ind ne),
Letele F L N (ind ne), Meyer Prof D (ind ne), Oliveira de Lima R (ind ne), Brody H R (ld ind ne), Dames B A (ne), Davis M (CFO), Dongwana N P
Pacak S J Z (ind ne), Sorour M R (ne), Xu Y (ind ne, China) (ind ne), Langeni P (ind ne), Leith R A G (ind ne), Makalima L (ind ne),
MAJOR ORDINARY SHAREHOLDERS as at 31 Mar 2025 Mminele A D (Chair, ind ne), Nkuhlu M C (COO), Quinn J P (CE),
Public Investment Corporation (SOC) Ltd. 23.38% Subramoney S (ne)
POSTAL ADDRESS: PO Box 2271, Cape Town, 8000 MAJOR ORDINARY SHAREHOLDERS as at 11 Aug 2025
MORE INFO: www.sharedata.co.za/sdo/jse/NPN Government Employees Pension Fund 15.37%
COMPANY SECRETARY: Lynelle Bagwandeen Allan Gray Ltd (SA) 6.88%
TRANSFER SECRETARY: JSE Investor Services (Pty) Ltd. BlackRock Inc. 5.03%
SPONSOR: Investec Bank Ltd. POSTAL ADDRESS: PO Box 1144, Johannesburg, 2000
EMAIL: NedGroupIR@Nedbank.co.za
AUDITORS: Deloitte & Touche Inc. WEBSITE: www.nedbankgroup.co.za
CAPITAL STRUCTURE Authorised Issued TELEPHONE: 011-294-4444
NPN N ords no par val 1 500 000 000 783 586 530 COMPANY SECRETARY: Jackie Katzin
DISTRIBUTIONS [ZARc] TRANSFER SECRETARY: JSE Investor Services (Pty) Ltd.
SPONSOR: Nedbank CIB
N ords no par val Ldt Pay Amt AUDITORS: Ernst & Young Inc., KPMG Inc.
Final No 96 2 Dec 25 8 Dec 25 508.00 CAPITAL STRUCTURE Authorised Issued
Final No 95 3 Dec 24 9 Dec 24 241.00 NED Ords 100c ea 600 000 000 477 272 628
LIQUIDITY: Jan26 Avg 10m shares p.w., R10 776.9m(68.7% p.a.)
DISTRIBUTIONS [ZARc]
Ords 100c ea Ldt Pay Amt
Interim No 65 2 Sep 25 8 Sep 25 1028.00
Final No 64 8 Apr 25 14 Apr 25 1104.00
LIQUIDITY: Dec25 Avg 9m shares p.w., R2 228.0m(96.8% p.a.)
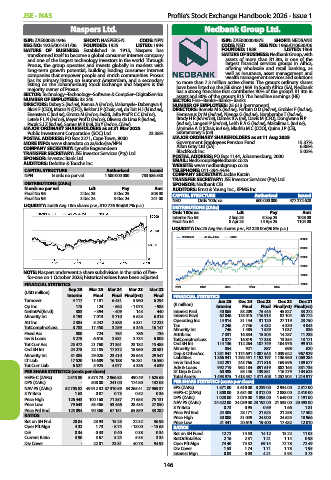
NEDBANK 40 Week MA BANK
35000
30000
25000
20000
NOTE: Naspers underwent a share subdivision in the ratio of five-
for-one on 1 October 2025; historical values have been adjusted. 15000
FINANCIAL STATISTICS 10000
Sep 25 Mar 25 Mar 24 Mar 23 Mar 22 2021 2022 2023 2024 2025
(USD million)
Interim Final Final Final(rst) Final FINANCIAL STATISTICS
Turnover 4 117 7 181 6 431 5 960 6 294 Jun 25 Dec 24 Dec 23 Dec 22 Dec 21
Op Inc 178 124 - 562 - 1 073 - 985 (R million) Interim Final Final Final(rst) Final(rst)
NetIntPd(Rcvd) 383 - 394 - 409 143 440 Interest Paid 40 865 83 209 75 445 45 827 33 272
Minority Int 3 193 7 013 3 710 5 623 6 315 Interest Rcvd 62 046 125 015 116 915 82 104 65 772
Att Inc 2 384 5 242 2 585 4 331 12 223 Operating Inc 14 914 31 144 31 120 27 119 23 750
TotCompInc/Loss 8 783 17 450 3 259 5 346 16 147 Tax 2 246 4 746 4 432 4 330 4 043
Minority Int
1 529
1 485
1 037
836
746
Fixed Ass 800 724 764 786 736 Attrib Inc 7 331 16 834 15 305 14 287 11 238
Inv & Loans 5 279 6 616 2 581 2 734 6 008 TotCompInc/Loss 8 877 16 819 17 338 13 354 13 171
Tot Curr Ass 25 472 21 760 21 361 23 182 15 485 Ord SH Int 114 136 112 264 107 749 104 976 99 513
Ord SH Int 24 278 22 185 17 872 18 960 20 581 Minority Int 854 921 887 698 620
Minority Int 31 385 29 026 23 410 25 645 29 547 Dep & OtherAcc 1 231 947 1 174 691 1 087 645 1 039 622 967 929
LT Liab 17 520 15 609 16 188 16 281 16 550 Liabilities 1 366 941 1 292 451 1 192 197 1 136 960 1 069 284
243 766
252 291
211 816
169 596
Inv & Trad Sec
189 677
Tot Curr Liab 6 527 5 925 4 077 4 336 4 639 Adv & Loans 992 719 962 184 891 619 882 165 831 735
PER SHARE STATISTICS (cents per share) ST Dep & Cash 60 398 55 146 139 851 116 279 104 623
HEPS-C (ZARc) 2 515.80 5 574.73 2 966.83 490.49 1 625.68 Total Assets 1 493 975 1 418 537 1 311 408 1 252 904 1 214 917
DPS (ZARc) - 508.00 241.00 174.80 132.05 PER SHARE STATISTICS (cents per share)
NAV PS (ZARc) 52 705.82 49 912.82 37 310.59 34 265.41 27 969.37 EPS (ZARc) 1 571.00 3 610.00 3 239.00 2 934.00 2 317.00
3 Yr Beta 1.63 0.87 0.73 0.52 0.36 HEPS-C (ZARc) 1 800.00 3 631.00 3 312.00 2 888.00 2 410.00
Price High 126 443 100 168 71 357 71 653 75 131 DPS (ZARc) 1 028.00 2 075.00 1 893.00 1 649.00 1 191.00
Price Low 79 643 63 486 53 466 28 435 27 850 NAV PS (ZARc) 24 522.00 24 039.00 23 192.00 21 533.00 20 493.00
1.66
1.81
0.69
0.73
0.95
Price Prd End 125 094 90 360 67 151 65 859 33 282 3 Yr Beta 24 305 28 171 21 623 21 258 17 502
Price Prd End
RATIOS Price High 30 008 31 049 24 000 24 625 18 966
Ret on SH Fnd 20.04 23.93 15.25 22.32 36.98 Price Low 21 441 20 619 19 400 17 482 12 010
Oper Pft Mgn 4.32 1.73 - 8.74 - 18.00 - 15.65 RATIOS
D:E 0.34 0.33 0.40 0.38 0.34 Ret on SH Fund 12.72 14.53 14.12 13.22 11.03
Current Ratio 3.90 3.67 5.24 5.35 3.34 RetOnTotalAss 2.16 2.31 1.21 1.14 0.98
Div Cover - 22.01 23.81 40.78 94.93 Oper Pft Mgn 74.40 74.32 69.14 72.78 72.49
Div Cover 1.53 1.74 1.71 1.78 1.95
Interest Mgn 0.03 0.03 4.21 3.93 3.73
146