
Page 188 - Profile's Stock Exchange Handbook - 2025 Issue 3
P. 188
JSE - SAN Profile’s Stock Exchange Handbook: 2025 - Issue 3
Santam Ltd. Santova Ltd.
ISIN: ZAE000093779 SHORT: SANTAM CODE: SNT ISIN: ZAE000159711 SHORT: SANTOVA CODE: SNV
REG NO: 1918/001680/06 FOUNDED: 1918 LISTED: 1964 REG NO: 1998/018118/06 FOUNDED: 1998 LISTED: 2002
NATURE OF BUSINESS: Santam is the leading general insurer in NATURE OF BUSINESS: The Santova Group is an international,
South Africa, with a market share of more than 22.0%. Santam was technology-based trade solutions specialist, delivering innovative
founded in 1918 and listed on the JSE in 1964 under the insurance end-to-end supply chain solutions. The Group is represented in 11
(nonlife) sector. The group has secondary listings on the Namibia countries through its own offices in South Africa, Australia, China,
Securities Exchange and A2X Markets Exchange. Santam is a Germany, Hong Kong, Mauritius, the Netherlands, Singapore,
subsidiary of the South African financial services group Sanlam, United Kingdom, United States and Vietnam.
which holds 59.1% of Santam’s issued shares (62.3% effective SECTOR: Inds--IndsGoods & Services--IndsTransport--MarineTransport
interest excluding Santam treasury shares held within the group). NUMBER OF EMPLOYEES: 273
Santam provides a diverse range of general insurance products and DIRECTORS: Garner E ( (ind ne), Ngubo E (ind ne), van Zyl A L,
services across Africa and internationally through a multi-channel Woodroffe T (ind ne), Stewart M E (Chair, ind ne), Gerber G (CEO),
approach that spans a network of more than 3 285 independent Robertson J (FD)
intermediaries, 516 tied agents, franchises and direct channels. MAJOR ORDINARY SHAREHOLDERS as at 14 May 2025
SECTOR: Fins--Insurance--Non-life Insurance--Property&CasualtyIns Barca Capital 15.33%
NUMBER OF EMPLOYEES: 6 339 A L van Zyl 12.58%
DIRECTORS: Da Silva C (ind ne), Fandeso M P (ld ind ne), Hanratty P B Glen Henry Gerber 5.81%
(ne), Loxton D (ind ne), Mlondolozi M (ne), Mukhuba A (ne), Ngulube POSTAL ADDRESS: PO Box 6148, Durban, 4000
J J (ind ne), Speckmann P (ind ne), Swartz L (ind ne), Wainwright R J MORE INFO: www.sharedata.co.za/sdo/jse/SNV
(ind ne), Moholi N T (Chair, ind ne), Madzinga T (CEO), Nel H D (CFO), COMPANY SECRETARY: J A Lupton
Olivier W (CFO) TRANSFER SECRETARY: Computershare Investor Services (Pty) Ltd.
MAJOR ORDINARY SHAREHOLDERS as at 31 Dec 2024 SPONSOR: River Group
Sanlam Ltd. 62.30% AUDITORS: Moore Stephens
POSTAL ADDRESS: PO Box 3881, Tyger Valley, 7536 CAPITAL STRUCTURE Authorised Issued
MORE INFO: www.sharedata.co.za/sdo/jse/SNT SNV Ords no par 300 000 000 129 640 438
COMPANY SECRETARY: Ruwaida Eksteen
TRANSFER SECRETARY: Computershare Investor Services (Pty) Ltd. DISTRIBUTIONS [ZARc]
SPONSOR: Investec Bank Ltd. Ords no par Ldt Pay Amt
AUDITORS: KPMG Inc. Final No 7 25 Jun 19 1 Jul 19 7.50
CAPITAL STRUCTURE Authorised Issued Final No 6 26 Jun 18 2 Jul 18 7.00
SNT Ords no par value 150 000 000 115 131 417 LIQUIDITY: Jul25 Avg 304 333 shares p.w., R2.3m(12.2% p.a.)
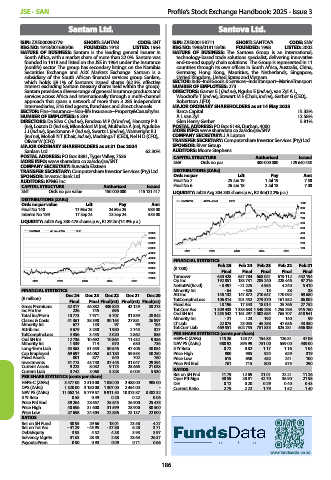
DISTRIBUTIONS [ZARc] SANTOVA 40 Week MA INDT
Ords no par value Ldt Pay Amt 1000
Final No 140 17 Mar 25 24 Mar 25 985.00 900
Interim No 139 17 Sep 24 23 Sep 24 535.00 800
700
LIQUIDITY: Jul25 Avg 330 475 shares p.w., R129.2m(14.9% p.a.) 600
500
SANTAM 40 Week MA NLIF
65000 400
60000 300
55000 200
50000 100
2021 2022 2023 2024 2025
45000
40000
35000 FINANCIAL STATISTICS
30000 (R ’000) Feb 25 Feb 24 Feb 23 Feb 22 Feb 21
25000 Final Final Final Final Final
20000 Turnover 630 428 637 784 668 021 619 112 442 194
2021 2022 2023 2024 2025 Op Inc 192 851 183 731 285 240 228 446 97 216
NetIntPd(Rcvd) - 8 497 - 21 225 4 953 4 240 5 410
FINANCIAL STATISTICS Minority Int - 64 - 526 15 38 38
Dec 24 Dec 23 Dec 22 Dec 21 Dec 20 Att Inc 148 132 147 872 210 647 170 092 69 680
(R million) TotCompIncLoss 106 314 201 452 279 370 161 352 86 002
Final Final Final(rst) Final(rst) Final(rst)
Gross Premiums 52 317 46 882 430 820 42 129 38 273 Fixed Ass 18 196 17 343 18 014 25 766 27 752
Inc Fm Inv 226 745 696 - - Tot Curr Ass 1 309 433 1 335 633 1 349 298 1 255 298 915 760
Total Inc/Prem 10 773 7 971 5 707 31 839 28 842 Ord SH Int 1 255 542 1 161 297 1 002 684 765 707 618 941
Claims & Costs 41 361 38 390 30 163 27 881 26 897 Minority Int - 21 123 192 140 99
Minority Int 677 133 97 99 104 LT Liab 22 075 23 035 45 258 47 636 43 350
Attrib Inc 3 679 3 250 1 980 2 745 327 Tot Curr Liab 469 551 602 755 751 835 825 281 656 385
TotCompIncLoss 4 356 3 455 2 020 2 862 855 PER SHARE STATISTICS (cents per share)
Ord SH Int 12 736 10 692 10 864 11 432 9 356 HEPS-C (ZARc) 115.26 123.77 154.83 126.81 47.08
Minority Int 1 339 714 670 630 736 NAV PS (ZARc) 980.92 895.99 751.00 559.00 439.00
Long-Term Liab 55 363 51 553 50 546 47 406 40 054 3 Yr Beta 0.72 0.82 1.17 1.16 1.04
Cap Employed 69 697 64 062 62 180 59 553 50 250 Price High 900 985 924 629 319
Fixed Assets 801 877 640 702 760 Price Low 615 650 452 241 100
Investments 51 773 43 748 37 446 31 047 29 394 Price Prd End 761 715 800 575 290
Current Assets 9 223 8 032 9 173 28 666 21 038 RATIOS
Current Liab 3 742 3 068 3 328 6 005 5 930
PER SHARE STATISTICS (cents per share) Ret on SH Fnd 11.79 12.69 21.01 22.21 11.26
Oper Pft Mgn
21.98
42.70
36.90
28.81
30.59
HEPS-C (ZARc) 3 477.00 2 310.00 1 830.00 2 488.00 905.00 D:E 0.12 0.20 0.29 0.40 0.43
DPS (ZARc) 1 520.00 3 180.00 1 307.00 2 454.00 - Current Ratio 2.79 2.22 1.79 1.52 1.40
NAV PS (ZARc) 11 062.14 9 779.57 9 911.50 10 373.87 8 482.32
3 Yr Beta 0.55 0.49 0.20 0.22 0.06
Price Prd End 39 264 28 657 25 645 26 900 25 478
Price High 40 696 31 600 31 599 28 900 30 500
Price Low 27 698 24 504 22 856 23 137 22 000
RATIOS
Ret on SH Fund 30.95 29.66 18.01 23.58 4.27
Ret on Tot Ass - 41.29 - 45.95 - 37.80 6.28 3.71
Debt:Equity 3.93 4.52 4.38 3.93 3.97
Solvency Mgn% 31.63 28.48 2.68 28.63 26.37
Payouts:Prem 0.90 0.93 0.09 0.71 0.66
www.fundsdata.co.za
186