
Page 54 - Profile's Stock Exchange Handbook - 2025 Issue 1
P. 54
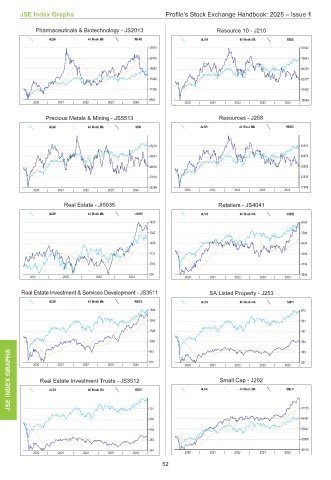
JSE Index Graphs                         Profile’s Stock Exchange Handbook: 2025 – Issue 1

           Pharmaceuticals & Biotechnology - JS2013            Resource 10 - J210
               ALSH       40 Week MA   PHAR               ALSH       40 Week MA    RESI
                                           25970                                       87052
                                           22476                                       75641
                                           18983                                       64229
                                           15489                                       52817
                                           11996                                       41406
                                           8503                                        29994
          2020  |  2021  |  2022  |  2023  |  2024  |  2020  |  2021  |  2022  |  2023  |  2024  |
              Precious Metals & Mining - JS5513                Resources - J258
               ALSH       40 Week MA    MINI              ALSH       40 Week MA   RESO


                                           65276                                       43391
                                           56057                                       36870
                                           46838                                       30350
                                           37619                                       23830
                                           28399                                       17309
          2020  |  2021  |  2022  |  2023  |  2024  |  2020  |  2021  |  2022  |  2023  |  2024  |
                   Real Estate - JI0035                        Retailers - JS4041
               ALSH       40 Week MA   JI0035             ALSH       40 Week MA   GERE
                                           1425                                        8709
                                           1327                                        7569
                                           1229                                        6429
                                           1131                                        5289
                                           1033                                        4149
                                           935                                         3009
          2021  |  2022  |  2023  |   2024  |         2020  |  2021  |  2022  |  2023  |  2024  |

       Real Estate Investment & Services Development - JS3511  SA Listed Property - J253
               ALSH       40 Week MA   REDS               ALSH       40 Week MA    SAPY
                                           1804                                        675
                                           1566                                        581
                                           1329                                        487
                                           1091                                        394
    GRAPHS  2020  |  2021  |  2022  |  2023  |  2024  |  616  2020  |  2021  |  2022  |  2023  |  2024  |  300
                                           853
                                                                                       207

    INDEX   Real Estate Investment Trusts - JS3512        ALSH  Small Cap - J202  SMLC
                                                                     40 Week MA
                                       REIV
               ALSH
                          40 Week MA
    JSE                                     721                                        81126
                                            602                                        68387
                                            482                                        55647
                                            363                                        42908
                                            244                                        30169
          2020  |  2021  |  2022  |  2023  |  2024  |  2020  |  2021  |  2022  |  2023  |  2024  |
                                               52