
Page 113 - Profile's Stock Exchange Handbook - 2025 Issue 1
P. 113
Profile’s Stock Exchange Handbook: 2025 – Issue 1 JSE – ENX
enX Group Ltd. EPE Capital Partners Ltd.
ENX EPE
ISIN: ZAE000222253 SHORT: ENXGROUP CODE: ENX ISIN: MU0522S00005 SHORT: ETHOSCAP CODE: EPE
REG NO: 2001/029771/06 FOUNDED: 1980 LISTED: 2007 REG NO: C138883 C1/GBL FOUNDED: 2016 LISTED: 2016
NATURE OF BUSINESS: enX Group Ltd. and its consolidated subsidiaries NATURE OF BUSINESS: EPE Capital Partners Ltd. (“Ethos Capital” or
(“the group”) are an industrial group listed on the JSE, providing “the Company”) is an investment holding company, registered and
integrated fleet management solutions and distributing quality branded incorporated in Mauritius and listed on the Johannesburg Stock Exchange
industrial, petrochemical and fuel products to a wide range of economic Ltd. (“JSE”). It invests directly into Funds or Co-Investments which give
sectors in South Africa and Sub-Saharan Africa. the Company largely indirect exposure to a diversified portfolio of unlisted
SECTOR: Inds—IndsGoods&Services—GeneralIndustr—DiversIndustr private equity-type investments (“Portfolio Companies”).Ethos Private
NUMBER OF EMPLOYEES: 750 Equity(Pty)Ltd.(“Ethos”),aleadingalternativeassetmanagementfirmin
DIRECTORS: MatthewsZK(ind ne), MokhoboRD(ld ind ne), Africa, has acted as the Company’s InvestmentAdvisor since July 2016 and
SimamaneNV(ind ne), Baloyi P (Chair, ne), Dawson J (Group CFO), in addition, has managed all the Funds that the Company invests in.
Lumb R (Group CEO) SECTOR: Fins—FinServcs—ClosedEndInvstmnts—ClosedEndInvstmnts
MAJOR ORDINARY SHAREHOLDERS as at 31 Aug 2024 NUMBER OF EMPLOYEES: 0
MCC Contracts (Pty) Ltd. 33.60% DIRECTORS: Allagapen K (ind ne), Juwaheer Y (ind ne), Pfaff M (ind ne),
PSG 10.70% Prout-Jones D (ind ne), Stillhart Y (Chair, ind ne), de Beer A C (CEO),
Samvenice Trading 7.00% van Onselen J (CFO)
POSTAL ADDRESS: PostNet Suite X86, Private Bag X7, Aston Manor, MAJOR ORDINARY SHAREHOLDERS as at 28 Oct 2024
1630 Consolidated Retirement Fund 9.28%
MORE INFO: www.sharedata.co.za/sdo/jse/ENX Government Employees Pension Fund 5.21%
COMPANY SECRETARY: Acorim (Pty) Ltd. MORE INFO: www.sharedata.co.za/sdo/jse/EPE
TRANSFER SECRETARY: Computershare Investor Services (Pty) Ltd. COMPANY SECRETARY: Ocorian (Mauritius) Ltd.
SPONSOR: The Standard Bank of South Africa Ltd. TRANSFER SECRETARY: Computershare Investor Services (Pty) Ltd.
AUDITORS: Deloitte & Touche Inc. SPONSOR: Rand Merchant Bank (A division of FirstRand Bank Ltd.)
AUDITORS: Deloitte & Touche Inc.
CAPITAL STRUCTURE AUTHORISED ISSUED
ENX Ords 0.001c ea 1 000 000 000 182 312 650 CAPITAL STRUCTURE AUTHORISED ISSUED
EPE A Ords no par val - 287 500 000
DISTRIBUTIONS [ZARc]
Ords 0.001c ea Ldt Pay Amt LIQUIDITY: Jan25 Avg 673 116 shares p.w., R2.9m(12.2% p.a.)
Special No 4 2 Jul 24 8 Jul 24 500.00 EQII 40 Week MA ETHOSCAP
Special No 3 21 Nov 23 27 Nov 23 100.00
1408
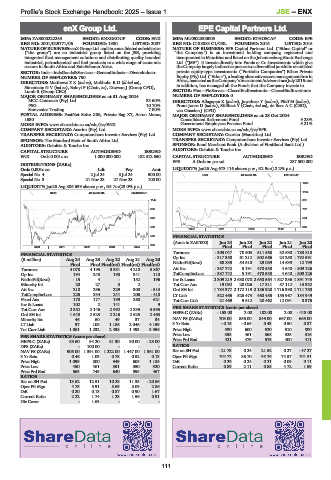
LIQUIDITY: Jan25 Avg 806 639 shares p.w., R5.7m(23.0% p.a.)
1194
GENI 40 Week MA ENXGROUP
1147 981
988 767
828 554
669 340
2020 | 2021 | 2022 | 2023 |
509 FINANCIAL STATISTICS
(Amts in ZAR’000) Jun 24 Jun 23 Jun 22 Jun 21 Jun 20
350 Final Final Final Final Final
2020 | 2021 | 2022 | 2023 | 2024 |
Turnover - 303 047 70 603 511 568 32 530 - 780 818
FINANCIAL STATISTICS
(R million) Aug 24 Aug 23 Aug 22 Aug 21 Aug 20 Op Inc - 317 350 61 212 502 666 24 258 - 792 591
Final Final Final(rst) Final(rst) Final(rst) NetIntPd(Rcvd) 68 835 54 510 29 089 14 639 12 799
Turnover 4 078 4 195 3 331 4 210 3 867 Att Inc - 387 742 5 191 470 538 4 640 - 809 126
Op Inc 194 248 190 341 110 TotCompIncLoss - 387 742 5 191 470 538 4 640 - 809 126
NetIntPd(Rcvd) - 15 4 - 152 196 Inv & Loans 2 309 219 2 688 078 2 650 564 1 827 336 1 891 743
Minority Int 20 27 3 2 - Tot Curr Ass 19 092 20 026 17 311 57 112 13 332
Att Inc 210 296 229 300 - 513 Ord SH Int 1 784 377 2 172 119 2 186 928 1 716 390 1 711 750
TotCompIncLoss 225 334 241 206 - 410 LT Liab 522 465 526 473 460 485 155 967 184 949
Fixed Ass 178 177 199 260 621 Tot Curr Liab 21 469 9 512 20 462 12 091 8 376
Inv & Loans 102 2 141 - 9
Tot Curr Ass 2 352 2 146 2 992 2 335 3 593 PER SHARE STATISTICS (cents per share) 182.00 2.00 - 413.00
2.00
HEPS-C (ZARc)
- 153.00
Ord SH Int 1 643 2 523 2 216 2 625 2 463
Minority Int 46 60 49 37 34 NAV PS (ZARc) 703.00 856.00 849.00 667.00 665.00
LT Liab 97 108 1 186 2 046 4 159 3 Yr Beta - 0.15 - 0.65 0.43 0.50 0.87
Tot Curr Liab 1 061 1 232 2 438 1 493 3 956 Price High 530 600 620 510 800
Price Low 353 461 368 325 316
PER SHARE STATISTICS (cents per share)
HEPS-C (ZARc) 83.60 94.20 81.30 90.00 - 23.00 Price Prd End 421 479 575 400 411
DPS (ZARc) - 100.00 - - - RATIOS
NAV PS (ZARc) 906.00 1 391.00 1 222.00 1 447.00 1 361.00 Ret on SH Fnd - 21.73 0.24 21.52 0.27 - 47.27
3 Yr Beta 0.46 1.03 0.75 0.52 0.13 Oper Pft Mgn 104.72 86.70 98.26 74.57 101.51
Price High 1 099 800 949 605 1 185 D:E 0.29 0.24 0.21 0.09 0.11
Price Low 450 461 551 350 320 Current Ratio 0.89 2.11 0.85 4.72 1.59
Price Prd End 563 745 640 595 467
RATIOS
Ret on SH Fnd 13.62 12.51 10.28 11.35 - 20.56
Oper Pft Mgn 4.75 5.91 5.69 8.09 2.86
D:E 0.20 0.13 0.87 0.90 1.67
Current Ratio 2.22 1.74 1.23 1.56 0.91
Div Cover - 1.63 - - -
111