
Page 88 - Profile's Stock Exchange Handbook -2024 Issue 4
P. 88
JSE – BEL Profile’s Stock Exchange Handbook: 2024 – Issue 4
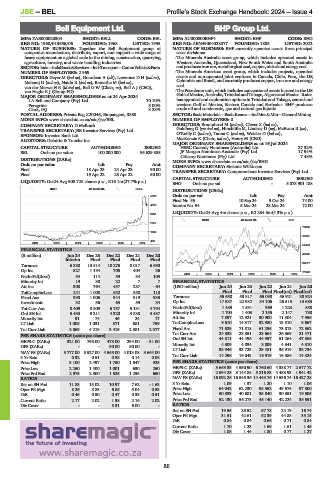
Bell Equipment Ltd. BHP Group Ltd.
BEL BHP
ISIN: ZAE000028304 SHORT: BELL CODE: BEL ISIN: AU000000BHP4 SHORT: BHP CODE: BHG
REG NO: 1968/013656/06 FOUNDED: 1968 LISTED: 1995 REG NO: ABN49004028077 FOUNDED: 1885 LISTED: 2022
NATURE OF BUSINESS: Together the Bell Equipment group of NATURE OF BUSINESS: BHP currently operates across three principal
companies manufacture, distribute, export, and support a wide range of asset divisions:
heavy equipment on a global scale to the mining, construction, quarrying, -The Minerals Australia asset group, which includes operated assets in
agriculture, forestry, and waste handling industries. Western Australia, Queensland, New South Wales and South Australia
SECTOR: Inds—IndsGoods&Services—IndsTransport—CommVehicle&Parts andproducesironore,metallurgicalcoal,copper,nickelandenergycoal.
NUMBER OF EMPLOYEES: 2 969 -The Minerals Americas asset group, which includes projects, operated
DIRECTORS: Geyer M (ind ne), Goordeen A (alt), LawranceDH(ind ne), assets and non-operated joint ventures in Canada, Chile, Peru, the US,
Maharaj U (ind ne), Naidu R (ind ne), Ramathe M (ind ne), Colombia and Brazil, and currently produces copper, iron ore and energy
van der MerweHR(ld ind ne), Bell G W (Chair, ne), Bell A J (CEO), coal.
van Haght K J (Group FD) -The Petroleum unit, which includes conventional assets located in the US
MAJOR ORDINARY SHAREHOLDERS as at 24 Apr 2024 Gulf of Mexico, Australia, Trinidad andTobago, Algeria andMexico. It also
I A Bell and Company (Pty) Ltd. 70.10% has appraisal and exploration options in Trinidad and Tobago, central and
Peregrine 5.00% western Gulf of Mexico, Eastern Canada and Barbados. BHP produces
Clark, IAJ 3.28% crude oil and condensate, gas and natural gas liquids.
POSTAL ADDRESS: Private Bag X20046, Empangeni, 3880 SECTOR:BasicMaterials—BasicResrcs—IndMet&Min—GeneralMining
MORE INFO: www.sharedata.co.za/sdo/jse/BEL NUMBER OF EMPLOYEES: 0
COMPANY SECRETARY: D McIlrath DIRECTORS: Broomhead M (ind ne), Clever X (ind ne),
TRANSFER SECRETARY: JSE Investor Services (Pty) Ltd. Goldberg G (snr ind ne), Hinchliffe M, Lindsay D (ne), McEwan R (ne),
SPONSOR: Investec Bank Ltd. O’Reilly C (ind ne), Tanna C (ind ne), Weisler D (ind ne),
AUDITORS: Deloitte & Touche Inc. MacKenzie K (Chair, ind ne), Henry M (CEO)
MAJOR ORDINARY SHAREHOLDERS as at 16 Jul 2024
CAPITAL STRUCTURE AUTHORISED ISSUED HSBC Custody Nominees (Australia) Ltd. 27.32%
BEL Ords no par value 100 000 000 95 629 385 JP Morgan Nominees Australia (Pty) Ltd. 17.94%
Citicorp Nominees (Pty) Ltd. 7.48%
DISTRIBUTIONS [ZARc] MORE INFO: www.sharedata.co.za/sdo/jse/BHG
Ords no par value Ldt Pay Amt COMPANY SECRETARY: Stefanie Wilkinson
Final 18 Apr 23 24 Apr 23 90.00 TRANSFER SECRETARY: Computershare Investor Services (Pty) Ltd.
Final 19 Apr 22 25 Apr 22 50.00
CAPITAL STRUCTURE AUTHORISED ISSUED
LIQUIDITY: Oct24 Avg 508 728 shares p.w., R16.1m(27.7% p.a.)
BHG Ords no par val - 5 073 901 188
INDT 40 Week MA BELL
DISTRIBUTIONS [USDc]
5130 Ords no par val Ldt Pay Amt
Final No 55 10 Sep 24 3 Oct 24 74.00
4196 Interim No 54 5 Mar 24 28 Mar 24 72.00
3261 LIQUIDITY: Oct24 Avg 4m shares p.w., R2 234.5m(4.3% p.a.)
INDM 40 Week MA BHP
2327
76069
1392
65121
458
2019 | 2020 | 2021 | 2022 | 2023 | 2024
54173
FINANCIAL STATISTICS
(R million) Jun 24 Dec 23 Dec 22 Dec 21 Dec 20 43225
Interim Final Final Final Final
32277
Turnover 6 380 13 514 10 276 8 017 6 690
Op Inc 527 1 194 705 404 36 21329
2019 | 2020 | 2021 | 2022 | 2023 | 2024
NetIntPd(Rcvd) 54 114 59 34 103
Minority Int 19 30 22 7 7 FINANCIAL STATISTICS
Att Inc 308 764 457 287 - 64 (USD million) Jun 24 Jun 23 Jun 22 Jun 21 Jun 20
TotCompIncLoss 241 1 008 552 358 110 Final Final Final Final(rst) Final(rst)
Fixed Ass 998 1 006 944 919 935 Turnover 55 658 53 817 65 098 56 921 38 924
Investments 32 36 63 59 34 Op Inc 17 537 22 932 34 106 25 515 13 683
Tot Curr Ass 8 409 8 509 6 757 5 131 4 794 NetIntPd(Rcvd) 1 489 1 531 969 1 223 858
Ord SH Int 5 433 5 211 4 320 3 838 3 487 Minority Int 1 704 1 403 2 155 2 147 780
Minority Int 91 74 45 24 17 Att Inc 7 897 12 921 30 900 11 304 7 956
LT Liab 1 005 1 031 871 681 759 TotCompIncLoss 9 610 14 317 32 980 13 510 8 667
Tot Curr Liab 3 869 4 219 3 415 2 381 2 377 Fixed Ass 71 629 71 818 61 295 73 813 72 362
Tot Curr Ass 24 338 23 351 28 664 26 369 21 471
PER SHARE STATISTICS (cents per share) Ord SH Int 44 811 44 496 44 957 51 264 47 865
HEPS-C (ZARc) 321.00 798.00 473.00 294.00 - 31.00
DPS (ZARc) - - 90.00 50.00 - Minority Int 4 309 4 034 3 809 4 341 4 310
NAV PS (ZARc) 5 777.00 5 527.00 4 565.00 4 013.08 3 664.00 LT Liab 38 946 33 723 29 481 36 919 38 734
Tot Curr Liab
14 824
16 919
19 043
14 296
16 386
3 Yr Beta 0.32 0.51 0.38 0.14 0.08
Price High 3 100 2 497 1 750 1 547 925 PER SHARE STATISTICS (cents per share)
Price Low 2 250 1 400 1 001 630 250 HEPS-C (ZARc) 3 663.33 4 550.90 6 760.60 4 388.77 2 677.72
Price Prd End 2 975 2 300 1 525 1 235 650 DPS (ZARc) 2 694.25 3 144.88 5 216.83 4 483.93 1 941.42
RATIOS NAV PS (ZARc) 16 092.26 16 545.36 14 443.76 14 536.74 16 427.28
Ret on SH Fnd 11.83 15.02 10.97 7.62 - 1.63 3 Yr Beta 1.09 1.37 1.20 1.10 1.06
Oper Pft Mgn 8.26 8.83 6.86 5.04 0.53 Price High 64 042 62 230 58 352 49 575 37 300
D:E 0.45 0.50 0.47 0.35 0.51 Price Low 50 333 40 681 35 840 30 351 19 505
Current Ratio 2.17 2.02 1.98 2.16 2.02 Price Prd End 52 130 56 273 45 140 42 224 35 551
Div Cover - - 5.31 6.00 - RATIOS
Ret on SH Fnd 19.55 29.52 67.78 24.19 16.74
Oper Pft Mgn 31.51 42.61 52.39 44.83 35.15
D:E 0.84 0.84 0.66 0.71 0.84
Current Ratio 1.70 1.23 1.69 1.61 1.45
Div Cover 1.08 1.44 1.80 0.77 1.27
86