
Page 52 - shbh24_complete
P. 52
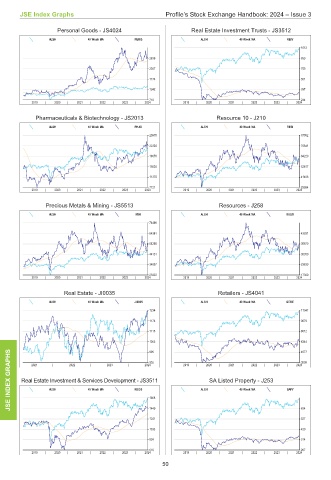
JSE Index Graphs                         Profile’s Stock Exchange Handbook: 2024 – Issue 3

                 Personal Goods - JS4024               Real Estate Investment Trusts - JS3512
               ALSH       40 Week MA   PERG               ALSH       40 Week MA    REIV
                                                                                       1012
                                           2839                                        859
                                           2307                                        705
                                           1774                                        551
                                           1242                                        397
                                           710                                         244
          2019  |  2020  |  2021  |  2022  |  2023  |  2024  2019  |  2020  |  2021  |  2022  |  2023  |  2024
           Pharmaceuticals & Biotechnology - JS2013            Resource 10 - J210
               ALSH       40 Week MA   PHAR               ALSH       40 Week MA    RESI
                                           25970                                       87052
                                           22320                                       75641
                                           18670                                       64229
                                           15020                                       52817
                                           11370                                       41406
                                           7721                                        29994
          2019  |  2020  |  2021  |  2022  |  2023  |  2024  2019  |  2020  |  2021  |  2022  |  2023  |  2024
              Precious Metals & Mining - JS5513                Resources - J258
               ALSH       40 Week MA    MINI              ALSH       40 Week MA   RESO
                                           74496
                                           64381                                       43391
                                           54266                                       36870
                                           44151                                       30350
                                           34037                                       23830
                                           23922                                       17309
          2019  |  2020  |  2021  |  2022  |  2023  |  2024  2019  |  2020  |  2021  |  2022  |  2023  |  2024

                   Real Estate - JI0035                        Retailers - JS4041
               ALSH       40 Week MA   JI0035             ALSH       40 Week MA   GERE
                                           1234                                        11347
                                           1174                                        9679
                                           1115                                        8012
                                           1055                                        6344
    GRAPHS  2021  |  2022  |   2023  |    2024 995   2019  |  2020  |  2021  |  2022  |  2023  |  2024 4677
                                                                                       3009
                                           935
    INDEX  Real Estate Investment & Services Development - JS3511  ALSH  SA Listed Property - J253  SAPY
                          40 Week MA
                                                                     40 Week MA
                                       REDS
               ALSH
    JSE                                    1658                                        634
                                           1449
                                           1241                                        527
                                           1033                                        420
                                           824                                         314
                                           616                                         207
          2019  |  2020  |  2021  |  2022  |  2023  |  2024  2019  |  2020  |  2021  |  2022  |  2023  |  2024
                                               50