


Page 59 - Profile's Stock Exchange Handbook - 2026 Issue 3
P. 59
Profile’s Stock Exchange Handbook: 2026 - Issue 3                  JSE Sector Table
       JSE Sector Table
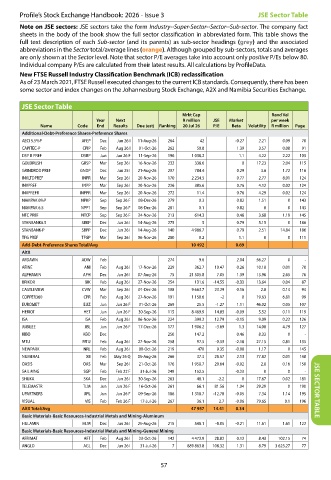
       Note on JSE sectors: JSE sectors take the form Industry--Super-Sector--Sector--Sub-sector. The company fact
       sheets in the body of the book show the full sector classification in abbreviated form. This table shows the
       full text description of each Sub-sector (and its parents) as sub-sector headings (grey) and the associated
       abbreviations in the Sector total/average lines (orange). Although grouped by sub-sectors, totals and averages
       are only shown at the Sector level. Note that sector P/E averages take into account only positive P/Es below 80.
       Individual company P/Es are calculated from their latest results. All calculations by ProfileData.
       New FTSE Russell Industry Classification Benchmark (ICB) reclassification
       As of 23 March 2021, FTSE Russell executed changes to the current ICB standards. Consequently, there has been
       some sector and index changes on the Johannesburg Stock Exchange, A2X and Namibia Securities Exchange.

       JSE Sector Table
                                                     Mrkt Cap                 Rand Val
                            Year   Next              R million    JSE    Market    per week
             Name      Code  End  Results  Due (est)  Ranking  20 Jul 26  P/E  Beta  Volatility  R million  Page
       Additional-Debt-Preference Shares-Preference Shares
       AECI 5.5%P       AFEP  Dec  Jun 26 I  11-Aug-26  264  42     -0.27  2.21  0.09  70
       CAPITEC-P         CPIP  Feb  Aug 26 I  01-Oct-26  262  50.8  1.39   3.57  0.08  91
       DSY B PREF       DSBP  Jun  Jun 26 F  11-Sep-26  196   1 038.2  1.1  4.22  2.22  103
       GOLDRUSH         GRSP  Mar  Sep 26 I  16-Nov-26  232  338.6    0   17.23  2.04  115
       GRINDROD PREF    GNDP  Dec  Jun 25 I  21-Aug-26  207  784.4  0.29   3.6   1.72  116
       INVLTDPREF       INPR  Mar  Sep 26 I  20-Nov-26  170   2 234.5  0.77  2.77  8.01  124
       INVPREF          INPP  Mar  Sep 26 I  20-Nov-26  226  385.6  0.76   4.12  0.02  124
       INVPREFR         INPPR  Mar  Sep 26 I  20-Nov-26  272  11.4  0.76   4.29  0.02  124
       NAMPAK 6%P       NPKP  Sep  Sep 26 F  08-Dec-26  279  0.3    0.82   1.51    0  143
       NAMPAK 6.5       NPP1  Sep  Sep 26 F  08-Dec-26  281  0.1    0.82    0      0  143
       NTC PREF         NTCP  Sep  Sep 26 F  24-Nov-26  213  614.3  0.48   3.68  1.19  145
       STANBANK6.5      SBKP  Dec  Jun 26 I  14-Aug-26  275  5      0.79   5.15    0  186
       STANBANK-P       SBPP  Dec  Jun 26 I  14-Aug-26  140   4 986.7  0.79  2.51  14.84  186
       TFG PREF         TFGP  Mar  Sep 26 I  06-Nov-26  280  0.2     1.1    0      0  111
       Add-Debt-Preference Shares Total/Avg               10 492    0 .69
       AltX
       AFDAWN           ADW  Feb                 274      9.6       2.04  56.27    0    -
       AFINE             ANI  Feb  Aug 26 I  17-Nov-26  229  362.7  10.47  0.26  10.18  0.01  70
       ALPHAMIN          APH  Dec  Jun 26 I  07-Aug-26  75   21 505.8  7.05  1.39  13.96  2.65  76
       BRIKOR            BIK  Feb  Aug 26 I  27-Nov-26  254  131.6  -14.55  -0.33  13.64  0.04  87
       CASTLEVIEW       CVW  Mar  Sep 26 I  01-Dec-26  108   9 663.7  23.29  0.16  2.8  0.14  94
       COPPER360         CPR  Feb  Aug 26 I  27-Nov-26  191   1 150.6  -2  0  19.63  6.81  99
       EUROMET           EUZ  Jun  Jun 26 F  31-Oct-26  269  25.5  -1.27  1.11  46.02  0.05  107
       HERIOT            HET  Jun  Jun 26 F  30-Sep-26  115   8 469.9  14.83  -0.09  5.52  0.11  119
       ISA               ISA  Feb  Aug 26 I  06-Nov-26  224  399.2  12.79  -0.15  9.09  0.22  126
       JUBILEE           JBL  Jun  Jun 26 F  17-Dec-26  177   1 906.2  -3.69  1.3  14.08  4.79  127
       KIBO              KBO  Dec                250    147.2       0.46   8.33    0    -
       MTU              MTU  Feb  Aug 26 I  27-Nov-26  258  97.5  -0.33  -2.18  27.15  0.81  135
       NEWPARK           NRL  Feb  Aug 26 I  09-Oct-26  219  470  9.35  -0.08  1.17  0  145
       NUMERAL            XII  Feb  May 26 Q  05-Aug-26  266  37.3  28.57  2.13  77.82  0.01  148
       OASIS             OAS  Mar  Sep 26 I  21-Oct-26  176   1 958.7  20.64  -0.02  2.8  0.16  150
       SAIL MNG          SGP  Feb  Feb 22 F  31-Jul-26  249  152.5  -0.23   0      0    -
       SHUKA             SKA  Dec  Jun 26 I  30-Sep-26  263  48.1  -2.2  0  17.67  0.02  181
       TELEMASTR         TLM  Jun  Jun 26 F  16-Oct-26  261  66.1  81.56  1.04  29.29  0  190
       UPARTNERS         UPL  Jun  Jun 26 F  09-Sep-26  186   1 318.7  -12.78  -0.05  7.34  1.14  195  JSE SECTOR TABLE
       VISUAL            VIS  Feb  Feb 26 F  17-Jul-26  267  36.1  2.7  -0.06  79.65  0.1  196
       AltX Total/Avg                                     47 957  14 .41  0 .34
       Basic Materials-Basic Resources-Industrial Metals and Mining-Aluminum
       HULAMIN          HLM  Dec  Jun 26 I  25-Aug-26  215  548.1  -8.05  -0.21  11.61  1.61  122
       Basic Materials-Basic Resources-Industrial Metals and Mining-General Mining
       AFRIMAT           AFT  Feb  Aug 26 I  23-Oct-26  142   4 472.9  28.82  0.12  8.43  102.15  74
       ANGLO             AGL  Dec  Jun 26 I  31-Jul-26  7   889 863.8  108.32  1.31  8.79   3 623.27  77


                                               57

