


Page 32 - Profile's Stock Exchange Handbook - 2026 Issue 3
P. 32
NSX - STI                               Profile’s Stock Exchange Handbook: 2026 - Issue 3
        FINANCIAL STATISTICS                      FINANCIAL STATISTICS
                    Dec 25   Dec 24   Dec 23  Dec 22   Dec 21   Feb 26   Feb 25   Feb 24   Feb 23  Feb 22
        (NAD million)  Final  Final Final(rst)  Final Final(rst)  (NAD ‘000)  Final  Final  Final  Final  Final
        Interest Rcvd  2 136  2 067  1 800  1 445  1 229  Turnover  36 372  25 088  29 708  17 373  19 566
        Operating Inc  1 717  1 632  1 279  1 049  851  Op Inc  85 285  108 925  76 792  84 377  10 710
        Minority Int    3    3     3     -     -  NetIntPd(Rcvd)  62 558  59 270  76 797  84 359  10 686
        Attrib Inc   1 187  1 050  766  624  365
        TotCompInc/Loss  1 179  1 062  765  628  366  Att Inc  22 727  49 755  -    -    -
        Ord SH Int   5 945  5 470  5 069  4 767  4 115  TotCompInc/Loss  22 727  49 755  -  -  -
        Dep & OtherAcc  33 100  34 003  30 209  27 353  28 256  Inv & Loans  662 397  626 419  503 690  467 492  601 358
        Liabilities  36 796  37 502  33 582  30 892  30 981  Tot Curr Ass  72 508  32 263  50 769  40 992  47 423
        Inv & Trad Sec  8 071  9 005  7 599  5 398  6 290  Ord SH Int  72 483  49 756  1  1  1
        Adv & Loans  30 882  27 633  26 954  25 969  25 382  LT Liab  796 991  755 638  707 707  647 144  -
        ST Dep & Cash  1 717  3 693  1 675  1 673  1 488  Tot Curr Liab  22 656  13 166  18 713  3 955  9 729
        Total Assets  42 766  42 993  38 670  35 675  35 319  PER SHARE STATISTICS (cents per share)
        PER SHARE STATISTICS (cents per share)    DPS (ZARc)   487.00  283.00  402.00  1 692.00  200.00
        HEPS-C (ZARc)  227.00  203.00  150.00  119.00  71.00  NAV PS (ZARc)  17 624.00 16 531.00 15 619.00 13 991.00 13 940.00
        DPS (ZARc)   142.00  138.00  100.00  66.00  31.00  3 Yr Beta  -  -    -     -  - 0.03
        NAV PS (ZARc)  1 137.82  1 047.00  970.00  912.00  841.00  Price High  12 801  12 801  12 790  12 790  12 790
        3 Yr Beta    - 0.41  - 0.41  - 0.48  - 0.14  -  Price Low  12 801  12 790  12 790  12 790  12 790
        Price Prd End  1 214  908  845  441  613  Price Prd End  12 801  12 801  12 790  12 790  12 790
        Price High   1 214  955   890  613   800  RATIOS
        Price Low     907   761   441  399   550  Ret on SH Fnd  31.35  100.00  -   -    -
        RATIOS                                    Oper Pft Mgn  234.48  434.17  258.49  485.68  54.74
        Ret on SH Fund  19.88  19.17  15.13  13.05  8.44  D:E   11.00  15.19 707 707.00 647 144.00  -
        RetOnTotalAss  4.02  3.79  3.31  2.98  2.41  Current Ratio  3.20  2.45  2.71  10.36  4.87
        Interest Mgn  0.05  0.05  0.05  0.04  0.03  Div Cover   1.00  3.78    -     -    -
        LiquidFnds:Dep  0.05  0.11  0.06  0.06  0.05           Tadvest Ltd.
              Stimulus Investments Ltd.
                                                  ISIN: MU0510N00001   SHORT: TADVEST   CODE: TAD
                                                  REG NO: 126446   FOUNDED: 2016   LISTED: 2016
        ISIN: NA000A1JN0Z7   SHORT: STIMULUS   CODE: SILP  NATURE  OF  BUSINESS:  Tadvest  Ltd.  invests  in  attractive,  high
        REG NO: 2004/482   FOUNDED: 2004   LISTED: 2004  growth,  cash  generative  assets,  providing  Shareholders  with  a
        NATURE  OF  BUSINESS:  Stimulus  Investments  Ltd.  focuses  on   combination of sustainable capital and income growth, through
         acquiring  investments  in  established,  high  cash  generating   a  portfolio  that  consists  of  private  equity  investments,  listed
         businesses in Namibia, which require empowerment credentials,   investments and investment properties.
         whilst also targeting more traditional private equity opportunities   SECTOR: Fins--FinServcs--ClosedEndInvstmnts--ClosedEndInvstmnts
         in  promising  businesses  with  potential  to  deliver  superior   NUMBER OF EMPLOYEES: 0
         returns.  The  company  was  funded  by  issuing  preference  shares   DIRECTORS: Chambers I, Coowar B S, Marianen D, Neser C B (ne),
         to  the  market  through  the  Namibia  Securities  Exchange  (NSX).   Savage D (ne)
         The  company’s  returns  are  allocated  between  the  preference   POSTAL ADDRESS: 7th Floor, Tower 1, NeXteracom Cybercity,
         shareholders and ordinary shareholders, based on a private equity   Ebene, Mauritius, 72201
         principle, whereby the preference shareholders are allocated 80%   MORE INFO: www.sharedata.co.za/sdo/jse/TAD
         of the returns and the ordinary shareholders 20%, subject to the   COMPANY SECRETARY: Safyr Utilis Fund Services Ltd.
         preference shareholders achieving a specified hurdle return. If the   TRANSFER SECRETARY: Transfer Secretaries (Pty) Ltd.
         company returns are below the hurdle rate, all returns are allocated   SPONSOR: Safyr Capital Partners Ltd.
         to the preference shareholders. The company operates principally   AUDITORS: Lancasters Chartered Accountants
         in Namibia.
        SECTOR: Add--Debt--Preference Shares--Pref Shares  CAPITAL STRUCTURE  Authorised  Issued
        NUMBER OF EMPLOYEES: 0                    TAD     Ords no par val      -      51 544 995
        DIRECTORS: Geingos M (ne), Mcleod E I (ind ne), Shejvali N (ind ne),
         Koep P F (Chair, ind ne, Namibia), Okafor C (Chair, ind ne)
        MAJOR ORDINARY SHAREHOLDERS as at 28 Feb 2026
         Ashburton Investment Managers (Pty) Ltd.   37.00%
         Spinnaker Holdings (Pty) Ltd.     37.00%
         Disability Benefit Trust           5.10%
        POSTAL ADDRESS: PO Box 97438, Windhoek, Namibia
        MORE INFO: www.sharedata.co.za/sdo/jse/SILP
        COMPANY SECRETARY: MMM Consultancy CC
        TRANSFER SECRETARY: Transfer Secretaries (Pty) Ltd.
        CAPITAL STRUCTURE      Authorised  Issued
        SILP   Pref shares           -      4 650 786
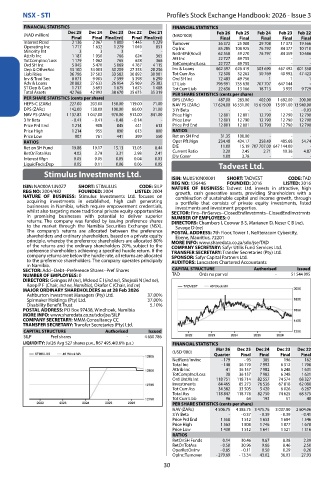
        LIQUIDITY: Jul26 Avg 527 shares p.w., R67 495.4(0.6% p.a.)  FINANCIAL STATISTICS
                                                              Mar 26   Dec 25  Dec 24   Dec 23   Dec 22
                                                  (USD ‘000)
                                                              Quarter  Final  Final  Final  Final
                                                  NetRent/InvInc  - 179  - 93  385  196  162
                                                  Total Inc     - 148  36 770  7 992  6 312  1 706
                                                  Attrib Inc     41  36 157  7 982  6 248  1 631
                                                  TotCompInc/Loss  38  36 157  7 982  6 248  1 631
                                                  Ord UntHs Int  118 751  118 714  82 557  74 574  68 327
                                                  Investments  84 465  85 273  76 536  67 818  62 088
                                                  Tot Curr Ass  34 382  33 505  5 420  6 026  6 287
                                                  Total Ass   118 847  118 778  82 750  74 625  68 375
                                                  Tot Curr Liab  96    64   193   51    48
                                                  PER SHARE STATISTICS (cents per share)
                                                  NAV (ZARc)  4 506.75  4 385.75 3 475.76  3 037.80  2 604.06
                                                  3 Yr Beta       -   - 0.37  - 0.39  - 0.39  - 0.41
                                                  Price Prd End  1 558  1 512  1 653  1 684  1 546
                                                  Price High    1 563  1 808  1 746  1 877  1 678
                                                  Price Low     1 430  1 512  1 641  1 521  1 316
                                                  RATIOS
                                                  RetOnSH Funds  0.14  30.46  9.67  8.38  2.39
                                                  RetOnTotAss   - 0.50  30.96  9.66  8.46  2.50
                                                  OperRetOnInv  - 0.85  - 0.11  0.50  0.29  0.26
                                                  OpInc:Turnover  - 279.69  - 13.34  43.02  36.03  27.93
                                                30

