


Page 192 - Profile's Stock Exchange Handbook - 2026 Issue 3
P. 192
JSE - TEL                               Profile’s Stock Exchange Handbook: 2026 - Issue 3
              TeleMasters Holdings Ltd.                    Telkom SA SOC Ltd.

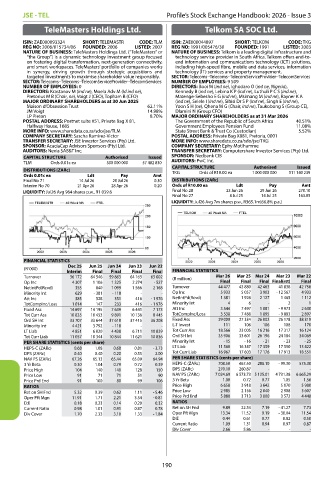
        ISIN: ZAE000093324   SHORT: TELEMASTR   CODE: TLM  ISIN: ZAE000044897   SHORT: TELKOM   CODE: TKG
        REG NO: 2006/015734/06   FOUNDED: 2006   LISTED: 2007  REG NO: 1991/005476/30   FOUNDED: 1991   LISTED: 2003
        NATURE OF BUSINESS: TeleMasters Holdings Ltd. (“TeleMasters” or   NATURE OF BUSINESS: Telkom is a leading digital infrastructure and
         “the Group”) is a dynamic technology investment group focused   technology service provider in South Africa. Telkom offers end-to-
         on fostering digital transformation, next-generation connectivity,   end information and communications technology (ICT) solutions,
         and smart workspaces. TeleMasters’ portfolio of companies works   including high-speed fibre, mobile and data services, information
         in  synergy,  driving  growth  through  strategic  acquisitions  and   technology (IT) services and property management.
         targeted investments to maximise shareholder value responsibly.  SECTOR: Telecoms--Telecoms--TelecomServiceProvider--TelecomServices
        SECTOR: Telecoms--Telecoms--TelecomServiceProvider--TelecomServices  NUMBER OF EMPLOYEES: 9 509
        NUMBER OF EMPLOYEES: 0                    DIRECTORS: Booi M (ind ne), Ighodaro O (ind ne, Nigeria),
        DIRECTORS: Krastanov M (ind ne), Moela Adv M (ld ind ne),    Kennedy B (ind ne), Lebina K P (ind ne), Luthuli P C S (ind ne),
         Pretorius M B (Chair, ne), Voigt J (CEO), Topham B (CFO)  Matenge-Sebesho E G (ind ne), Msimang M (ind ne), Rayner K A
        MAJOR ORDINARY SHAREHOLDERS as at 30 Jun 2025   (ind ne), Selele I (ind ne), Sibisi Dr S P (ind ne), Singh E (ind ne),
         Maison d’Obsession Trust          62.11%   Yoon S H (ne), Qhena M G (Chair, ind ne), Taukobong S (Group CE),
         JM Voigt                          14.98%   Dlamini N (Group CFO)
         LP Pieton                          8.70%  MAJOR ORDINARY SHAREHOLDERS as at 31 Mar 2026
        POSTAL ADDRESS: Postnet suite #51, Private Bag X 81,    The Government of the Republic of South Africa   40.51%
         Halfway House, 1685                       Government Employees Pension Fund   11.08%
        MORE INFO: www.sharedata.co.za/sdo/jse/TLM  State Street Bank & Trust Co (Custodian)   5.52%
        COMPANY SECRETARY: Sascha Ramirez-Victor  POSTAL ADDRESS: Private Bag X881, Pretoria, 0001
        TRANSFER SECRETARY: JSE Investor Services (Pty) Ltd.  MORE INFO: www.sharedata.co.za/sdo/jse/TKG
        SPONSOR: AcaciaCap Advisors Sponsors (Pty) Ltd.  COMPANY SECRETARY: Ephy Motlhamme
        AUDITORS: Nexia SAB&T Inc.                TRANSFER SECRETARY: Computershare Investor Services (Pty) Ltd.
        CAPITAL STRUCTURE      Authorised  Issued  SPONSOR: Nedbank CIB
        TLM    Ords 0.01c ea      500 000 000     57 482 830  AUDITORS: PwC Inc.
                                                                         Authorised
                                                                                      Issued
        DISTRIBUTIONS [ZARc]                      CAPITAL STRUCTURE       1 000 000 000     511 140 239
                                                          Ords of R10.00 ea
                                                  TKG
        Ords 0.01c ea     Ldt      Pay       Amt
        Final No 71    14 Jul 26  20 Jul 26  0.30  DISTRIBUTIONS [ZARc]
        Interim No 70  21 Apr 26  28 Apr 26  0.20  Ords of R10.00 ea  Ldt     Pay      Amt
        LIQUIDITY: Jul26 Avg 964 shares p.w., R1 039.6  Final No 28  23 Jun 26  29 Jun 26  270.10
                                                  Final No 27     8 Jul 25  14 Jul 25  163.05
                                                  LIQUIDITY: Jul26 Avg 7m shares p.w., R365.1m(66.8% p.a.)


        FINANCIAL STATISTICS
                    Dec 25   Jun 25  Jun 24   Jun 23   Jun 22
        (R ‘000)
                    Interim  Final  Final  Final  Final  FINANCIAL STATISTICS
        Turnover     36 172  64 546  59 863  64 163  65 002  (R million)  Mar 26   Mar 25  Mar 24   Mar 23   Mar 22
        Op Inc        4 307  1 106  1 325  2 274  - 527         Final  Final  Final Final(rst)  Final
        NetIntPd(Rcvd)  355  840  1 099  1 566  2 168  Turnover  44 477  43 880  42 463  41 838  42 756
        Minority Int  629   - 381  - 118  -    -  Op Inc        5 933  5 057  3 903  - 12 567  4 933
        Att Inc       385   528   351   416  - 1 976  NetIntPd(Rcvd)  1 381  1 926  2 127  1 465  1 112
        TotCompInc/Loss  1 014  147  233  416  - 1 976  Minority Int  4  6   -     2     1
        Fixed Ass    14 697  14 195  7 639  6 441  7 173  Att Inc  3 544  7 497  1 881  - 9 973  2 630
        Tot Curr Ass  10 835  10 453  9 891  10 136  8 445  TotCompInc/Loss  3 538  7 488  1 895  - 9 883  2 897
        Ord SH Int   33 707  33 644  37 618  37 415  36 208  Fixed Ass  29 009  27 334  26 002  26 178  38 319
        Minority Int  4 421  3 792  - 118  -   -  L-T Invest     111  106   106   108   170
        LT Liab       4 851  6 020  4 438  6 711  10 839  Tot Curr Ass  18 566  23 005  16 216  17 317  16 124
        Tot Curr Liab  11 057  10 344  10 844  11 621  10 836  Ord SH Int  35 906  33 601  26 196  24 184  34 069
        PER SHARE STATISTICS (cents per share)    Minority Int   - 15  - 16  - 21  - 23  - 25
        HEPS-C (ZARc)  0.68  1.08  0.68  0.81  - 3.73  LT Liab  11 560  16 347  17 359  17 550  13 422
        DPS (ZARc)    0.40  0.40  0.20  0.55  2.00  Tot Curr Liab  16 967  17 603  17 176  17 913  18 551
        NAV PS (ZARc)  67.26  65.13  65.44  65.09  64.94  PER SHARE STATISTICS (cents per share)
        3 Yr Beta     0.30  1.04  0.79  0.72  0.39  HEPS-C (ZARc)  708.50  467.50  288.10  - 99.30  575.30
        Price High    104   140   140   128  150  DPS (ZARc)   270.10  260.87  -   -     -
        Price Low      91    71   71    51    90  NAV PS (ZARc)  7 024.69  6 573.73 5 125.01  4 731.38  6 665.29
        Price Prd End  91   100   80    99   106  3 Yr Beta     1.00  0.72  0.77  1.05  1.56
        RATIOS                                    Price High    6 658  3 918  3 642  5 070  5 980
        Ret on SH Fnd  5.32  0.39  0.62  1.11  - 5.46  Price Low  2 985  2 156  2 040  2 908  3 607
        Oper Pft Mgn  11.91  1.71  2.21  3.54  - 0.81  Price Prd End  5 880  3 713  3 000  3 572  4 448
        D:E           0.18  0.23  0.14  0.20  0.32  RATIOS
        Current Ratio  0.98  1.01  0.91  0.87  0.78  Ret on SH Fnd  9.89  22.34  7.19  - 41.27  7.73
        Div Cover     1.70  2.33  3.10  1.33  - 1.84  Oper Pft Mgn  13.34  11.52  9.19  - 30.04  11.54
                                                  D:E           0.44  0.61  0.77  0.82  0.50
                                                  Current Ratio  1.09  1.31  0.94  0.97  0.87
                                                  Div Cover     2.66  5.86   -     -     -


                                               190

