


Page 130 - Profile's Stock Exchange Handbook - 2026 Issue 3
P. 130
JSE - KAL                               Profile’s Stock Exchange Handbook: 2026 - Issue 3
                   KAL Group Ltd.                                KAP Ltd.

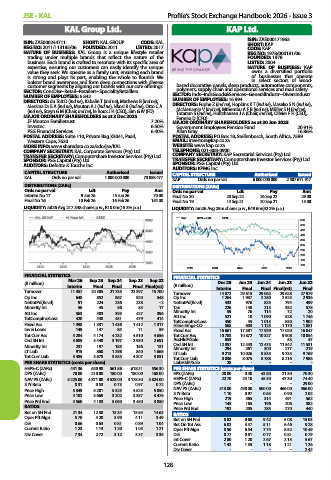
        ISIN: ZAE000244711   SHORT: KAL GROUP   CODE: KAL              ISIN: ZAE000171963
                                                                       SHORT: KAP
        REG NO: 2011/113185/06   FOUNDED: 2011   LISTED: 2017          CODE: KAP
        NATURE  OF  BUSINESS:  KAL  Group  is  a  unique  lifestyle  retailer   REG NO: 1978/000181/06
         trading  under  multiple  brands  that  reflect  the  nature  of  the   FOUNDED: 1978
         business. Each brand is crafted to resonate with its specific area of   LISTED: 2004
         expertise, ensuring our customers can easily identify the unique   NATURE  OF  BUSINESS:  KAP
         value they seek. We operate as a family unit, ensuring each brand   owns  a  diversified  portfolio
         is  strong  and  plays  its  part,  enabling  the  whole  to  flourish.  We   of  businesses  that  operate
         bolster brand awareness and form deep connections with diverse   in  select  sectors  of  wood-
         customer segments by aligning our brands with our core offerings.  based decorative panels, sleep products, automotive components,
        SECTOR: ConsDisr--Retail--Retailers--SpecialityRetaillers  polymers, supply chain and operational services and road safety.
        NUMBER OF EMPLOYEES: 6 842                SECTOR: Inds--IndsGoods&Services--GeneralIndustr--DiversIndustr
        DIRECTORS: du Toit D (ind ne), Kabalin T (ind ne), Mathews B (ind ne),   NUMBER OF EMPLOYEES: 16 994
         Messina Dr E A (ind ne), Mouton A J (ind ne), Nkosi R (ind ne), Otto C A   DIRECTORS: Fuphe Z (ind ne), Hopkins K T (ind ne), Maseko S N (ind ne),
                                                   McMenamin V (ind ne), Mthembu A F B (ind ne), Müller S H (ind ne),
         (ind ne), Steyn G M (Chair, ind ne), le Roux J H (CEO), Sim G W (FD)  Totaram S (ind ne), Holtzhausen J A (Chair, ind ne), Olivier F H (CEO),
        MAJOR ORDINARY SHAREHOLDERS as at 3 Dec 2025   Ferreira D (CFO)
         JF Mouton Familietrust             7.20%   MAJOR ORDINARY SHAREHOLDERS as at 30 Jun 2025
         Investec                           6.50%   Government Employees Pension Fund   20.91%
         PSG Financial Services             6.40%  Allan Gray                        16.86%
        POSTAL ADDRESS: Suite 110, Private Bag X3041, Paarl,    POSTAL ADDRESS: PO Box 18, Stellenbosch, South Africa, 7599
         Western Cape, 7620                       EMAIL: investors@kap.co.za
        MORE INFO: www.sharedata.co.za/sdo/jse/KAL  WEBSITE: www.kap.co.za
        COMPANY SECRETARY: KAL Corporate Services (Pty) Ltd.  TELEPHONE: 021-808-0900
        TRANSFER SECRETARY: Computershare Investor Services (Pty) Ltd.  COMPANY SECRETARY: KAP Secretarial Services (Pty) Ltd.
        SPONSOR: PSG Capital (Pty) Ltd.           TRANSFER SECRETARY: Computershare Investor Services (Pty) Ltd.
        AUDITORS: Deloitte & Touche Inc.          SPONSOR: PSG Capital (Pty) Ltd.
                                                  AUDITORS: KPMG Inc.
        CAPITAL STRUCTURE      Authorised  Issued  CAPITAL STRUCTURE     Authorised  Issued
        KAL    Ords no par val    1 000 000 000     73 888 477  KAP  Ords no par val    6 000 000 000    2 507 671 917
        DISTRIBUTIONS [ZARc]                      DISTRIBUTIONS [ZARc]
        Ords no par val   Ldt      Pay       Amt  Ords no par val   Ldt       Pay      Amt
        Interim No 17   9 Jun 26  15 Jun 26  70.00  Final No 20  20 Sep 22  26 Sep 22  29.00
        Final No 16    10 Feb 26  16 Feb 26  154.00  Final No 19  14 Sep 21  20 Sep 21  15.00
        LIQUIDITY: Jul26 Avg 217 348 shares p.w., R10.0m(15.3% p.a.)  LIQUIDITY: Jun26 Avg 25m shares p.w., R49.6m(52.2% p.a.)
                                                    KAP  40 Week MA  GENI
                                                                                      550
                                                                                      500
                                                                                      450
                                                                                      400
                                                                                      350
                                                                                      300
                                                                                      250
                                                                                      200
                                                                                      150
                                                                                      100
                                                      2022   2023   2024   2025   2026
        FINANCIAL STATISTICS                      FINANCIAL STATISTICS
                    Mar 26   Sep 25  Sep 24   Sep 23   Sep 22
        (R million)                                            Dec 25   Jun 25  Jun 24   Jun 23   Jun 22
                    Interim  Final  Final  Final Final(rst)  (R million)  Interim  Final  Final Final(rst)  Final
        Turnover     11 357  20 305  21 735  22 397  15 700  Turnover  14 872  29 615  29 062  29 628  27 979
        Op Inc        648   852   867  920   548  Op Inc        1 264  1 937  2 250  2 523  2 936
        NetIntPd(Rcvd)  91  224   236  238    - 2  NetIntPd(Rcvd)  433  976  825  794   499
        Minority Int   56    45   56    53    17  Tax            226  148   213   352   578
                                                                                        20
                                                                                  72
                                                                            114
                                                                 59
        Att Inc       363   403   395  427   396  Minority Int   521   76  1 090  528  1 746
                                                                       10
                                                  Att Inc
        TotCompInc/Loss  420  448  451  479  414  TotCompInc/Loss  450  45  1 013  830  1 902
        Fixed Ass    1 398  1 331  1 436  1 412  1 317  Hline Erngs-CO  568  603  1 125  1 170  1 851
        Inv & Loans   149   147   84    71    59  Fixed Ass    16 661  17 581  17 929  17 020  16 047
        Tot Curr Ass  4 284  4 174  4 232  4 510  4 656  Tot Curr Ass  10 783  10 872  10 327  9 908  10 054
        Ord SH Int   3 689  3 440  3 197  2 930  2 691  AssHldF/Sale  653  -  -   53    47
        Minority Int  237   197   185  156   131  Ord SH Int   12 857  12 443  12 475  11 542  11 531
                                                                                        219
                                                                                  277
                                                                 294
                                                                      261
                                                                            300
        LT Liab       915   860  1 298  840  1 665  Minority Int  9 213  10 026  9 535  9 735  9 769
                                                  LT Liab
        Tot Curr Liab  3 485  3 678  3 535  4 307  3 851  Tot Curr Liab  8 036  8 075  8 788  8 216  7 986
        PER SHARE STATISTICS (cents per share)    LiabHldF/Sale  28     -    -     -     -
        HEPS-C (ZARc)  441.36  620.98  561.58  618.31  556.30  PER SHARE STATISTICS (cents per share)
        DPS (ZARc)   70.00  210.00  180.00  180.00  168.00  EPS (ZARc)  20.80  0.40  43.80  21.30  70.30
        NAV PS (ZARc)  5 225.00  4 871.00 4 528.00  4 178.30  3 824.00  HEPS-C (ZARc)  22.70  24.10  45.30  47.30  74.40
        3 Yr Beta     0.31  0.53  0.73  0.97  0.72  DPS (ZARc)    -     -    -     -   29.00
        Price High   5 349  5 201  5 325  4 525  5 850  NAV PS (ZARc)  513.00  498.00  500.00  466.00  466.00
        Price Low    4 102  3 669  3 202  3 357  3 476  3 Yr Beta  1.10  0.97  0.63  0.90  2.02
        Price Prd End  4 560  4 183  5 050  3 450  3 850  Price High  219  365  314  491  562
                                                  Price Low
                                                                                        382
                                                                 145
                                                                      165
                                                                            196
                                                                                  206
        RATIOS                                    Price Prd End  192  205   285   270   440
        Ret on SH Fnd  21.34  12.30  13.34  15.55  14.63  RATIOS
        Oper Pft Mgn  5.70  4.20  3.99  4.11  3.49  Ret on SH Fnd  8.82  0.68  9.42  5.08  15.03
        D:E           0.66  0.63  0.81  0.89  1.04  Ret On Tot Ass  6.02  3.47  5.11  6.46  9.28
        Current Ratio  1.23  1.13  1.20  1.05  1.21  Oper Pft Mgn  8.50  6.54  7.74  8.52  10.49
        Div Cover     7.34  2.72  3.12  3.37  3.35  D:E         0.77  0.81  0.77  0.81  0.79
                                                  Int Cover     2.80  1.20  2.67  2.15  5.67
                                                  Current Ratio  1.42  1.35  1.18  1.21  1.26
                                                  Div Cover       -     -    -     -   2.42
                                               128

