
Page 7 - Profile's Stock Exchange Handbook - 2026 Issue 2
P. 7
Profile’s Stock Exchange Handbook: 2026 - Issue 2 About the Stock Exchange Handbook
The Corporate Events Table provides a summary The Stock Exchange Handbook represents a ‘snapshot’
of new listings, delistings, name changes, sector of these highly up-to-date databases as close to the
changes, splits, and consolidations that took place print deadline as possible.
between issues of the Stock Exchange Handbook. Readers can access up-to-date information at:
Compilation of the Stock www.sharedata.co.za
Exchange Handbook Sources of Information
ProfileData, which incorporates the research
Publication Cycle division of the Profile Group, is a primary data
source, and most of our information is researched
The Stock Exchange Handbook is published in
February, May, August and November each year. independently and drawn directly from each
Reporting of results by JSE listed companies is company’s own reports and accounts. SENS notices,
published financials and other announcements are
currently concentrated in three distinct periods – processed on a real-time basis.
March-May, August-September, and November.
The publication of four books per year enhances the Our research team has close working relationships
inclusion of recently published results even further. with most listed companies, and all companies
The various databases from which the Stock receive regular proofs from our database. Changes
or omissions brought to our attention by listed
Exchange Handbook is compiled are updated on companies are corrected immediately. We would
virtually a real-time basis. Our ShareData system, from like to thank listed companies for their ongoing co-
which the handbook’s financial statistics are drawn, operation, and for checking and returning proofs.
is updated on a daily basis, and we receive earnings
estimates from stockbroking firms on a weekly basis.
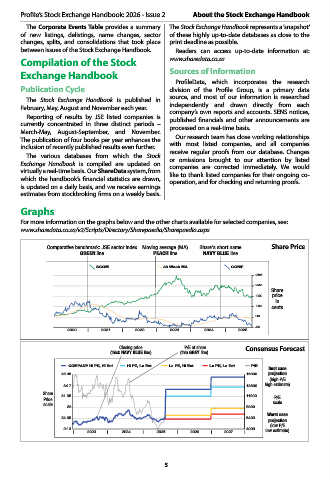
Graphs
For more information on the graphs below and the other charts available for selected companies, see:
www.sharedata.co.za/v2/Scripts/Directory/Sharepaedia/Sharepaedia.aspx
Comparative benchmark: JSE sector index Moving average (MA) Share’s short name Share Price
GREEN line PEACH line NAVY BLUE line
SCOM 40 Week MA COMP
286
238
Share
190 price
in
142 cents
94
46
2020 | 2021 | 2022 | 2023 | 2024 | 2025
Closing price P/E of share Consensus Forecast
(thick NAVY BLUE line) (thin GREY line)
COMPANY Hi PE, Hi Est Hi PE, Lo Est Lo PE, Hi Est Lo PE, Lo Est P/E
Best case
38.05 16000 projection
(high P/E
high estimate)
34.7 13600
Share
Price 31.35 11200 P/E
scale scale
28 8800
Worst case
24.65 6400 projection
(low P/E
21.3 4000 low estimate)
| 2023 | 2024 | 2025 | 2026 | 2027 |
5