
Page 63 - Profile's Stock Exchange Handbook - 2026 Issue 2
P. 63
Profile’s Stock Exchange Handbook: 2026 - Issue 2 JSE Sector Table
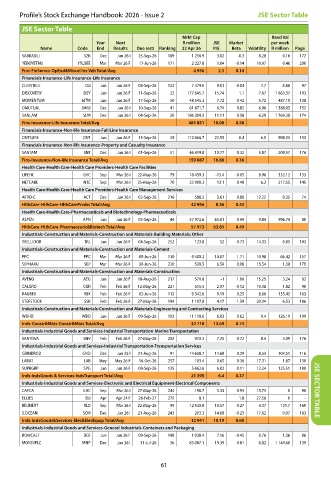
JSE Sector Table
Mrkt Cap Rand Val
Year Next R million JSE Market per week
Name Code End Results Due (est) Ranking 22 Apr 26 P/E Beta Volatility R million Page
SABKABILI SZK Dec Jun 26 I 25-Sep-26 189 1 216.9 3.02 -0.3 8.28 0.16 172
YEBOYETHU YYLBEE Mar Mar 26 F 17-Jun-26 171 2 227.8 1.04 -0.14 10.97 0.46 200
Fins-FinServcs-OpEnd&Miscel Inv Veh Total/Avg 4 936 2 .1 0 .14
Financials-Insurance-Life Insurance-Life Insurance
CLIENTELE CLI Jun Jun 26 F 08-Sep-26 122 7 479.0 9.01 -0.04 7.7 0.88 97
DISCOVERY DSY Jun Jun 26 F 11-Sep-26 22 177 645.7 15.74 1.1 7.67 1 683.37 103
MOMENTUM MTM Jun Jun 26 F 17-Sep-26 50 48 545.3 7.72 0.42 5.72 487.19 138
OMUTUAL OMU Dec Jun 26 I 10-Sep-26 41 61 871.7 6.74 0.82 6.96 1 388.05 152
SANLAM SLM Dec Jun 26 I 04-Sep-26 20 186 309.5 11.11 0.58 6.29 1 769.38 174
Fins-Insurance-Life Insurance Total/Avg 481 851 10 .06 0 .58
Financials-Insurance-Non-life Insurance-Full Line Insurance
OUTSURE OUT Jun Jun 26 F 15-Sep-26 29 112 666.7 22.95 0.4 6.5 998.33 153
Financials-Insurance-Non-life Insurance-Property and Casualty Insurance
SANTAM SNT Dec Jun 26 I 01-Sep-26 51 46 419.8 10.77 0.32 5.87 209.57 176
Fins-Insurance-Non-life Insurance Total/Avg 159 087 16 .86 0 .36
Health Care-Health Care-Health Care Providers-Health Care Facilities
LIFEHC LHC Sep Mar 26 I 22-May-26 79 18 459.3 -13.4 -0.05 8.96 332.12 133
NETCARE NTC Sep Mar 26 I 25-May-26 70 23 908.3 13.1 0.48 6.2 217.55 145
Health Care-Health Care-Health Care Providers-Health Care Management Services
AFRO-C ACT Dec Jun 26 I 02-Sep-26 216 588.5 3.61 0.86 12.22 0.35 74
HlthCare-HtlhCare-HlthCarePrvdrs Total/Avg 42 956 8 .36 0 .43
Health Care-Health Care-Pharmaceuticals and Biotechnology-Pharmaceuticals
ASPEN APN Jun Jun 26 F 03-Sep-26 44 57 972.6 63.81 0.49 9.84 996.74 80
HlthCare-HtlhCare-Pharmaceutic&Biotech Total/Avg 57 973 63 .81 0 .49
Industrials-Construction and Materials-Construction and Materials-Building Materials: Other
TRELLIDOR TRL Jun Jun 26 F 04-Sep-26 252 123.8 52 0.73 14.33 0.85 193
Industrials-Construction and Materials-Construction and Materials-Cement
PPC PPC Mar Mar 26 F 09-Jun-26 110 9 400.3 14.07 1.71 10.98 66.42 157
SEPHAKU SEP Mar Mar 26 F 30-Jun-26 220 539.5 6.59 0.08 15.54 1.38 179
Industrials-Construction and Materials-Construction and Materials-Construction
AVENG AEG Jun Jun 26 F 18-Aug-26 217 570.8 -1 1.06 15.25 3.24 82
CALGRO CGR Feb Feb 26 F 12-May-26 221 515.5 2.97 -0.12 10.38 1.82 90
RAUBEX RBX Feb Feb 26 F 02-Jun-26 112 9 342.0 9.19 0.25 8.66 135.42 163
STEFSTOCK SSK Feb Feb 26 F 27-May-26 194 1 107.8 4.17 1.59 20.34 6.53 186
Industrials-Construction and Materials-Construction and Materials-Engineering and Contracting Services
WBHO WBO Jun Jun 26 F 09-Sep-26 103 11 118.6 6.83 0.62 9.4 126.19 199
Inds-Constr&Mats-Constr&Mats Total/Avg 32 718 13 .69 0 .74
Industrials-Industrial Goods and Services-Industrial Transportation-Marine Transportation
SANTOVA SNV Feb Feb 26 F 27-May-26 202 970.3 7.25 0.72 8.4 3.09 176
Industrials-Industrial Goods and Services-Industrial Transportation-Transportation Services
GRINDROD GND Dec Jun 25 I 21-Aug-26 91 14 658.7 11.68 0.29 8.53 104.51 116
LABAT LAB May May 26 F 16-Oct-26 257 103.4 0.65 0.36 17.31 1.87 130
SUPRGRP SPG Jun Jun 26 F 08-Sep-26 135 5 662.6 6.02 0.11 12.24 125.51 188
Inds-IndsGoods & Services-IndsTransport Total/Avg 21 395 6 .4 0 .37
Industrials-Industrial Goods and Services-Electronic and Electrical Equipment-Electrical Components
CAFCA CAC Sep Mar 26 I 27-May-26 244 198.7 5.33 0.93 15.73 0 90 JSE SECTOR TABLE
ELLIES ELI Apr Apr 24 F 26-Feb-27 275 8.1 1.8 27.56 0 -
REUNERT RLO Sep Mar 26 I 22-May-26 99 12 530.8 10.57 0.27 4.37 121.7 169
S.OCEAN SOH Dec Jun 26 I 21-Aug-26 243 203.3 14.68 -0.23 17.62 0.07 183
Inds-IndsGoods&Services-Elec&ElecEquip Total/Avg 12 941 10 .19 0 .69
Industrials-Industrial Goods and Services-General Industrials-Containers and Packaging
BOWCALF BCF Jun Jun 26 F 09-Sep-26 198 1 038.4 7.16 -0.45 8.76 1.36 86
MONDIPLC MNP Dec Jun 26 I 31-Jul-26 36 83 087.1 19.39 0.81 6.82 1 149.60 139
61