
Page 177 - Profile's Stock Exchange Handbook - 2026 Issue 2
P. 177
Group Annual Results for the year
ended 31 December 2025
Total net fund inflows Return on Group Equity Value per share
Earnings R126,8 billion (R54 billion in 2024) 13,4%
Net result from financial services Net value of new convered business Adjusted Return on Group Equity Value per share
3% 21% to R2,3 billion 15,7%
Net operational earnings Net new convered business margin Capital management
7% 2,01% (2,81% in 2024) Discretionary capital at 31 December 2025
New business Group Equity Value R8,1 billion
Life insurance new business volumes (PVNBP) Group Equity Value per share Sanlam Group economic solvency cover ratio
10% to R114 billion R87,73 183% (December 2024: 188%)
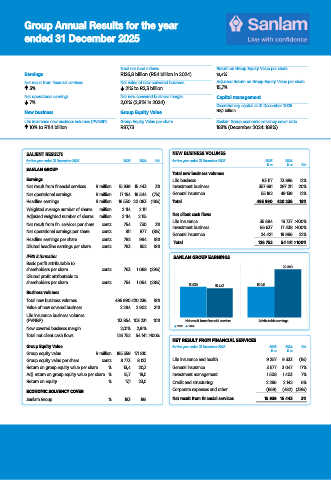
SALIENT RESULTS NEW BUSINESS VOLUMES
for the year ended 31 December 2025 2025 2024 % for the year ended 31 December 2025 2025 2024
R’m R’m %
SANLAM GROUP
Total new business volumes
Earnings Life business 83 117 73 886 12%
Net result from financial services R million 15 939 15 443 3% Investment business 357 691 297 211 20%
Net operational earnings R million 17 154 18 544 (7%) General insurance 55 182 49 139 12%
Headline earnings R million 16 550 20 083 (18%) Total 495 990 420 236 18%
Weighted average number of shares million 2 114 2 111
Adjusted weighted number of shares million 2 114 2 115 Net client cash fl ows
Net result from fin. services per share cents 754 730 3% Life insurance 35 694 16 737 >100%
66 637
Investment business
17 438 >100%
Net operational earnings per share cents 811 877 (8%)
General insurance 24 421 19 966 22%
Headline earnings per share cents 792 964 18% Total 126 752 54 141 >100%
Diluted headline earnings per share cents 783 952 18%
IFRS information SANLAM GROUP EARNINGS
Basic profit attributable to
shareholders per share cents 763 1 068 (29%) 22 240
Diluted profit attributable to
shareholders per share cents 754 1 054 (28%)
15 939 15 443 15 941
Business volumes
Total new business volumes 495 990 420 236 18%
Value of new covered business 2 294 2 902 21%
Life insurance business volumes
(PVNBP) 113 854 103 231 10% Net result from financial services Attributable earnings
New covered business margin 2,01% 2,81% 2025 2024
Total net client cash flows 126 752 54 141 >100%
NET RESULT FROM FINANCIAL SERVICES
Group Equity Value for the year ended 31 December 2025 2025 2024 %
Group equity value R million 185 559 171 810 R’m R’m
Group equity value per share cents 8 773 8 123 Life insurance and health 9 257 9 333 (1%)
Return on group equity value per share % 13,4 20,3 General insurance 3 577 3 047 17%
Adj. return on group equity value per share % 15,7 18,0 Investment management 1 508 1 403 7%
Return on equity % 17,1 23,0 Credit and structuring 2 266 2 142 6%
ECONOMIC SOLVENCY COVER Corporate expenses and other (669) (482) (39%)
Sanlam Group % 183 188 Net result from financial services 15 939 15 443 3%
21/04/2026 15:50:07
JSE R&E book AR2025 v20260421.indd 1 21/04/2026 15:50:07
JSE R&E book AR2025 v20260421.indd 1