
Page 112 - Profile's Stock Exchange Handbook - 2026 Issue 2
P. 112
JSE - FIN Profile’s Stock Exchange Handbook: 2026 - Issue 2
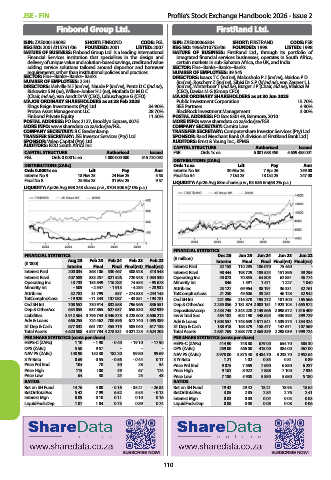
Finbond Group Ltd. FirstRand Ltd.
ISIN: ZAE000138095 SHORT: FINBOND CODE: FGL ISIN: ZAE000066304 SHORT: FIRSTRAND CODE: FSR
REG NO: 2001/015761/06 FOUNDED: 2001 LISTED: 2007 REG NO: 1966/010753/06 FOUNDED: 1998 LISTED: 1998
NATURE OF BUSINESS: Finbond Group Ltd. is a leading international NATURE OF BUSINESS: FirstRand Ltd., through its portfolio of
Financial Services institution that specialises in the design and integrated financial services businesses, operates in South Africa,
delivery of unique value and solution-based savings, credit and value certain markets in sub-Saharan Africa, the UK, and India.
adding service solutions tailored around depositor and borrower SECTOR: Fins--Banks--Banks--Banks
requirements rather than institutional policies and practices. NUMBER OF EMPLOYEES: 39 545
SECTOR: Fins--Banks--Banks--Banks DIRECTORS: Isaacs T C (ind ne), Makosholo P J (ind ne), Naidoo P D
NUMBER OF EMPLOYEES: 2 341 (ind ne), Roscherr Z (ind ne), Sibisi Dr S P (ld ind ne), von Zeuner L L
DIRECTORS: Melville N J (ind ne), Naude P (ind ne), Pentz D C (ind ne), (ind ne), Winterboer T (ind ne), Burger J P (Chair, ind ne), Vilakazi M
Riskowitz S M (ne), Wilken-Jonker H J (ne), Motlatla Dr M D C (CEO), Davias M G (Group CFO)
(Chair, ind ne), van Aardt Dr W (CEO), Labuschagne G (CFO) MAJOR ORDINARY SHAREHOLDERS as at 30 Jun 2025
MAJOR ORDINARY SHAREHOLDERS as at 28 Feb 2025 Public Investment Corporation 15.70%
Kings Reign Investments (Pty) Ltd. 34.90% BEE Partners 4.90%
Protea Asset Management LLC 28.70% BlackRock Investment Management 3.00%
Finbond Private Equity 11.50% POSTAL ADDRESS: PO Box 650149, Benmore, 2010
POSTAL ADDRESS: PO Box 2127, Brooklyn Square, 0075 MORE INFO: www.sharedata.co.za/sdo/jse/FSR
MORE INFO: www.sharedata.co.za/sdo/jse/FGL COMPANY SECRETARY: Carnita Low
COMPANY SECRETARY: B C Bredenkamp TRANSFER SECRETARY: Computershare Investor Services (Pty) Ltd.
TRANSFER SECRETARY: JSE Investor Services (Pty) Ltd. SPONSOR: Rand Merchant Bank (A division of FirstRand Bank Ltd.)
SPONSOR: Valeo Capital (Pty) Ltd. AUDITORS: Ernst & Young Inc., KPMG
AUDITORS: BDO South Africa Inc. CAPITAL STRUCTURE Authorised Issued
CAPITAL STRUCTURE Authorised Issued FSR Ords 1c ea 6 001 688 450 5 609 488 001
FGL Ords 0.0001c ea 1 000 000 000 515 720 092 DISTRIBUTIONS [ZARc]
DISTRIBUTIONS [ZARc] Ords 1c ea Ldt Pay Amt
Ords 0.0001c ea Ldt Pay Amt Interim No 55 30 Mar 26 7 Apr 26 259.00
Interim No 9 18 Nov 25 24 Nov 25 5.50 Final No 54 7 Oct 25 13 Oct 25 247.00
Final No 8 25 Mar 25 31 Mar 25 9.57 LIQUIDITY: Apr26 Avg 68m shares p.w., R5 636.6m(63.2% p.a.)
LIQUIDITY: Apr26 Avg 698 248 shares p.w., R704 506.5(7.0% p.a.)
FINANCIAL STATISTICS
FINANCIAL STATISTICS Dec 25 Jun 25 Jun 24 Jun 23 Jun 22
Aug 25 Feb 25 Feb 24 Feb 23 Feb 22 (R million) Interim Final Final Final(rst) Final(rst)
(R ‘000)
Interim Final Final Final(rst) Final(rst) Interest Paid 52 153 110 295 106 070 75 460 -
Interest Paid 200 034 368 106 330 467 308 928 313 548 Interest Rcvd 98 444 198 729 189 524 151 896 59 295
Interest Rcvd 407 589 833 257 821 526 720 948 1 034 530 Operating Inc 40 073 70 855 64 805 62 851 46 774
Operating Inc 18 733 153 849 116 285 74 553 - 95 678 Minority Int 846 1 591 1 471 1 227 1 040
Minority Int - 509 - 2 547 - 1 913 - 4 284 - 28 932 Attrib Inc 23 127 69 964 38 191 36 331 32 761
Attrib Inc 52 782 31 799 557 - 274 835 - 244 145 TotCompInc/Loss 21 250 49 606 39 251 46 128 32 942
TotCompInc/Loss - 19 920 - 71 343 137 087 - 43 851 - 193 781 Ord SH Int 221 396 216 370 195 272 181 300 165 566
Ord SH Int 708 552 730 914 832 558 796 966 836 551 Dep & OtherAcc 2 255 856 2 181 874 2 003 151 1 923 103 1 655 972
Dep & OtherAcc 634 055 637 865 627 637 658 830 832 939 Deposits&Accep 2 433 745 2 343 228 2 149 566 2 098 572 1 816 409
Liabilities 3 912 364 3 796 743 3 446 373 3 228 600 3 606 212 Inv & Trad Sec 484 182 502 190 448 625 436 392 399 729
Adv & Loans 666 255 724 462 700 596 672 740 1 095 389 Adv & Loans 1 803 557 1 748 639 1 611 541 1 539 375 1 334 324
ST Dep & Cash 677 832 661 787 455 719 585 040 617 138 ST Dep & Cash 188 418 168 379 158 477 147 671 107 569
Total Assets 4 620 508 4 527 784 4 278 331 4 021 225 4 624 203 Total Assets 2 681 769 2 588 770 2 369 339 2 298 039 1 999 724
PER SHARE STATISTICS (cents per share) PER SHARE STATISTICS (cents per share)
HEPS-C (ZARc) 1.10 - 1.90 - 0.40 - 19.10 - 17.90 HEPS-C (ZARc) 414.90 748.80 679.00 654.70 585.30
DPS (ZARc) 5.50 9.57 - - - DPS (ZARc) 259.00 466.00 415.00 384.00 467.00
NAV PS (ZARc) 148.90 152.30 182.20 99.80 99.69 NAV PS (ZARc) 3 978.00 3 875.40 3 484.70 3 233.70 2 952.64
3 Yr Beta 0.69 0.55 - 0.56 - 0.44 0.17 3 Yr Beta 1.21 1.02 0.85 0.81 0.89
Price Prd End 104 70 30 28 54 Price Prd End 9 075 7 569 7 690 6 850 6 237
Price High 115 100 49 67 174 Price High 9 162 8 922 7 868 7 100 7 934
Price Low 64 30 24 25 48 Price Low 7 180 5 908 5 890 5 680 5 180
RATIOS RATIOS
Ret on SH Fund 14.76 4.00 - 0.16 - 35.21 - 26.83 Ret on SH Fund 19.42 29.42 18.21 18.93 18.62
RetOnTotalAss 5.42 7.99 6.52 5.55 - 0.13 RetOnTotalAss 3.05 2.85 2.84 2.76 2.41
Interest Mgn 0.09 0.10 0.11 0.10 0.16 Interest Mgn 0.03 0.03 0.04 0.03 0.03
LiquidFnds:Dep 1.07 1.04 0.73 0.89 0.74 LiquidFnds:Dep 0.08 0.08 0.08 0.08 0.06
SUBSCRIBE NOW! SUBSCRIBE NOW!
110