
Page 56 - Profile's Stock Exchange Handbook - 2026 Issue 1
P. 56
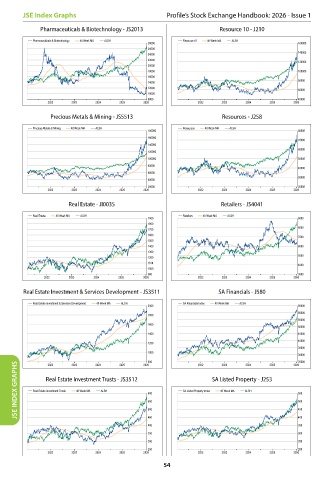
JSE Index Graphs Profile’s Stock Exchange Handbook: 2026 - Issue 1
Pharmaceuticals & Biotechnology - JS2013 Resource 10 - J210
Pharmaceuticals & Biotechnology 40 Week MA ALSH Resource 10 40 Week MA ALSH
28000 160000
26000
140000
24000
22000 120000
20000
18000 100000
16000
14000 80000
12000
60000
10000
8000 40000
2022 2023 2024 2025 2026 2022 2023 2024 2025 2026
Precious Metals & Mining - JS5513 Resources - J258
Precious Metals & Mining 40 Week MA ALSH Resources 40 Week MA ALSH
180000 80000
160000
70000
140000
60000
120000
100000 50000
80000
40000
60000
30000
40000
20000 20000
2022 2023 2024 2025 2026 2022 2023 2024 2025 2026
Real Estate - JI0035 Retailers - JS4041
Real Estate 40 Week MA ALSH Retailers 40 Week MA ALSH
1900 9000
1800
8000
1700
1600 7000
1500
1400 6000
1300
1200 5000
1100
4000
1000
900 3000
2022 2023 2024 2025 2026 2022 2023 2024 2025 2026
Real Estate Investment & Services Development - JS3511 SA Financials - J580
Real Estate Investment & Services Development 40 Week MA ALSH SA Financials Index 40 Week MA ALSH
2000 65000
60000
1800
55000
1600
50000
1400 45000
40000
1200
35000
1000
30000
25000
800
JSE INDEX GRAPHS Real Estate Investment Trusts 40 Week MA ALSH 600 SA Listed Property Index SA Listed Property - J253 550
2025
2024
2022
2026
2024
2022
2025
2026
2023
2023
Real Estate Investment Trusts - JS3512
40 Week MA
ALSH
550
500
500
400
450
350
400 450
350 300
300 250
250 200
2022 2023 2024 2025 2026 2022 2023 2024 2025 2026
54