
Page 198 - Profile's Stock Exchange Handbook - 2026 Issue 1
P. 198
JSE - TRA Profile’s Stock Exchange Handbook: 2026 - Issue 1
Transpaco Ltd. Trellidor Holdings Ltd.
ISIN: ZAE000007480 SHORT: TRNPACO CODE: TPC ISIN: ZAE000209342 SHORT: TRELLIDOR CODE: TRL
REG NO: 1951/000799/06 FOUNDED: 1940 LISTED: 1987 REG NO: 1970/015401/06 FOUNDED: 1970 LISTED: 2015
NATURE OF BUSINESS: Transpaco manufactures and distributes NATURE OF BUSINESS: The Trellidor Group has a proven track record
plastic and paper packaging products for sectors of the economy in the physical barrier security, window coverings and door opening
including retail, industrial, agriculture, mining, pharmaceutical solutions. Comprising two main trading brands, Trellidor and Taylor,
and automotive. Transpaco’s products are customised to customer Trellidor has become the leading manufacturer of custom-made
requirements and distributed across the country and exported into solutions with an extensive franchise, distributor and branch
Southern Africa. Transpaco operates through two main divisions: network that spans South Africa, Africa, and the United Kingdom.
Plastic Products and Paper & Board. SECTOR: Inds--Constr&Mats--Constr&Mats--BldngMats:Other
SECTOR: Inds--IndsGoods&Services--GeneralIndustr--Cont&Pckgng NUMBER OF EMPLOYEES: 503
NUMBER OF EMPLOYEES: 1 434 DIRECTORS: Claasen C (Alternate, ind ne), Patmore R B (ind ne),
DIRECTORS: Botha H A (ind ne), Bouzaglou S R, Mahlangu S Y Hodgson K (Chair, ind ne), Dennison T M (CEO), Judge D J R (CFO)
(ind ne), van der Linde S (ld ind ne), Thomas D J J (Chair, ne), MAJOR ORDINARY SHAREHOLDERS as at 30 Jun 2025
Abelheim P N (CEO), Weinberg L (CFO) Mazi Asset Management (Pty) Ltd. 9.93%
MAJOR ORDINARY SHAREHOLDERS as at 5 Mar 2025 Aylett and Company (Pty) Ltd. 8.14%
CEPPWAWU Investments (Pty) Ltd. 23.10% Legae Peresec (Pty) Ltd. 7.28%
PN Abelheim 13.91% POSTAL ADDRESS: PO Box 20173, Durban North, 4016
Old Mutual Group 12.22% MORE INFO: www.sharedata.co.za/sdo/jse/TRL
POSTAL ADDRESS: PO Box 39601, Bramley, 2018 COMPANY SECRETARY: Paula Nel
MORE INFO: www.sharedata.co.za/sdo/jse/TPC TRANSFER SECRETARY: Computershare Investor Services (Pty) Ltd.
COMPANY SECRETARY: H J van Niekerk SPONSOR: PSG Capital (Pty) Ltd.
TRANSFER SECRETARY: Computershare Investor Services (Pty) Ltd. AUDITORS: PKF (Durban)
SPONSOR: Investec Bank Ltd. CAPITAL STRUCTURE Authorised Issued
AUDITORS: BDO South Africa Inc. TRL Ords no par val 5 000 000 000 95 209 820
CAPITAL STRUCTURE Authorised Issued DISTRIBUTIONS [ZARc]
TPC Ords 1c ea 250 000 000 27 839 388 Ords no par val Ldt Pay Amt
DISTRIBUTIONS [ZARc] Final No 12 22 Sep 25 29 Sep 25 12.00
Ords 1c ea Ldt Pay Amt Final No 11 28 Sep 21 4 Oct 21 11.00
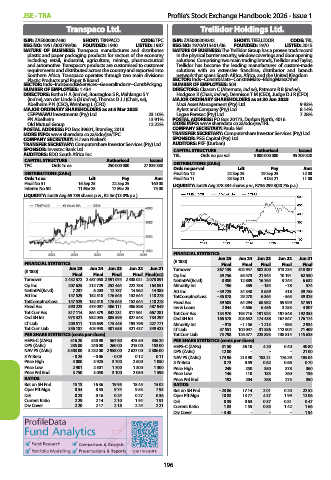
Final No 51 16 Sep 25 22 Sep 25 160.00 LIQUIDITY: Jan26 Avg 378 334 shares p.w., R736 299.3(20.7% p.a.)
Interim No 50 11 Mar 25 17 Mar 25 75.00
LIQUIDITY: Jan26 Avg 69 789 shares p.w., R2.5m(13.0% p.a.)
FINANCIAL STATISTICS
Jun 25 Jun 24 Jun 23 Jun 22 Jun 21
FINANCIAL STATISTICS (R ‘000) Final Final Final Final Final
Jun 25 Jun 24 Jun 23 Jun 22 Jun 21 Turnover 367 139 402 947 502 300 513 234 518 387
(R ‘000)
Final Final Final Final Final(rst) Op Inc 39 756 55 473 21 944 10 191 62 530
Turnover 2 432 372 2 487 058 2 591 074 2 338 021 2 078 891 NetIntPd(Rcvd) 8 380 12 889 16 764 9 244 6 632
Op Inc 207 625 212 729 252 464 222 758 164 851 Minority Int 196 369 - 154 - 78 574
NetIntPd(Rcvd) 7 237 6 203 12 757 14 962 14 385 Att Inc - 39 729 34 340 3 629 418 39 755
Att Inc 147 529 152 518 176 645 152 644 110 278 TotCompInc/Loss - 36 878 29 270 6 364 - 565 39 325
TotCompInc/Loss 147 529 152 518 176 645 152 644 110 278 Fixed Ass 59 505 64 294 68 982 59 929 57 591
Fixed Ass 590 223 475 097 486 111 486 898 487 949 Inv & Loans 2 044 4 686 6 456 3 253 4 807
Tot Curr Ass 817 114 864 379 842 231 817 961 667 281 Tot Curr Ass 134 970 195 716 191 924 197 548 192 353
Ord SH Int 975 321 932 035 885 595 827 543 734 297 Ord SH Int 166 578 203 652 174 438 167 847 176 174
LT Liab 200 511 126 639 175 448 193 796 227 771 Minority Int - 918 - 1 156 - 1 213 - 985 2 934
Tot Curr Liab 356 187 403 948 401 658 421 437 349 423 LT Liab 57 551 100 047 31 386 112 904 71 409
PER SHARE STATISTICS (cents per share) Tot Curr Liab 73 798 126 577 225 893 138 814 115 635
HEPS-C (ZARc) 516.20 520.90 567.80 475.50 336.20 PER SHARE STATISTICS (cents per share)
DPS (ZARc) 235.00 240.00 260.00 215.00 153.00 HEPS-C (ZARc) 31.50 36.10 4.20 0.40 40.80
NAV PS (ZARc) 3 503.00 3 232.00 2 958.00 2 627.00 2 306.00 DPS (ZARc) 12.00 - - - 21.00
3 Yr Beta - 0.25 - 0.06 - 0.09 0.12 0.11 NAV PS (ZARc) 174.96 213.90 183.21 176.29 185.04
Price High 4 000 3 925 3 700 2 600 1 850 3 Yr Beta 0.73 0.59 0.62 0.66 0.70
Price Low 2 901 2 501 1 700 1 300 1 300 Price High 249 250 350 378 360
Price Prd End 3 750 3 050 3 100 2 050 1 598 Price Low 146 110 183 260 136
RATIOS Price Prd End 192 204 268 275 350
Ret on SH Fnd 15.13 16.36 19.95 18.45 15.02 RATIOS
Oper Pft Mgn 8.54 8.55 9.74 9.53 7.93 Ret on SH Fnd - 23.86 17.14 2.01 0.20 22.52
D:E 0.23 0.16 0.24 0.27 0.36 Oper Pft Mgn 10.83 13.77 4.37 1.99 12.06
Current Ratio 2.29 2.14 2.10 1.94 1.91 D:E 0.39 0.63 0.37 0.81 0.47
Div Cover 2.20 2.17 2.18 2.24 2.21 Current Ratio 1.83 1.55 0.85 1.42 1.66
Div Cover - 3.48 - - - 1.94
196