Page 171 - Profile's Stock Exchange Handbook - 2026 Issue 1
P. 171

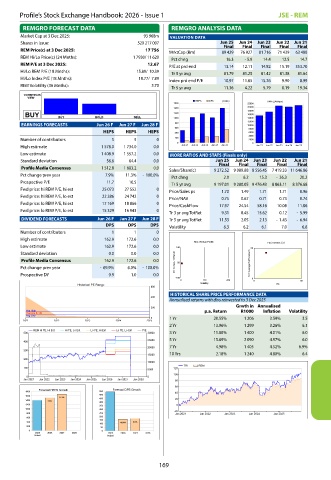
Profile’s Stock Exchange Handbook: 2026 - Issue 1                        JSE - REM
        REMGRO FORECAST DATA                      REMGRO ANALYSIS DATA
       Market Cap at 3 Dec 2025:          93 968m  VALUATION DATA
       Shares in issue:                  529 217 007            Jun 25  Jun 24  Jun 23  Jun 22  Jun 21
                                                                 Final  Final  Final  Final  Final
       REM Price(c) at 3 Dec 2025:          17 756  MrktCap (Rm)    89 429    76 927    81 716    71 439   63 488
       REM Hi/Lo Price(c) (24 Mnths):   1 7930/ 11 620  Pct chng   16.3  - 5.9   14.4   12.5   14.7
       REM P/E at 3 Dec 2025:                12.67  P/E at prd end   13.14   12.11   14.82   15.19   353.70
       Hi/Lo REM P/E (18 Mnths):         15.89/  10.39  Tr 5 yr avg   81.79   81.25   81.42   81.38   81.64
       Hi/Lo Index P/E (18 Mnths):        18.77/  7.89  Index prd end P/E   10.97   11.65   15.26   9.90   8.99
       REM Volatility (36 Mnths):             3.70  Tr 5 yr avg   11.36   4.22   5.79   8.19   19.34
        CONSENSUS
         VIEW
                                                         HEPS  DPS  (ZARc)   NAV (ZAR/cps)
                                                  1600                 22000
                                                  1400                 20000
                                                                       18000
        BUY       BUY       HOLD       SELL       1200                 16000
                                                                       14000
                                                  1000
                                                                       12000
       EARNINGS FORECASTS   Jun 26 F  Jun 27 F  Jun 28 F  800          10000
                                                   600                  8000
                              HEPS   HEPS  HEPS    400                  6000
                                                                        4000
       Number of contributors    5     5      0    200                  2000
                                                   0                     0
       High estimate           1 578.0   1 734.0    0.0  Jun 21  Jun 22  Jun 23  Jun 24  Jun 25  Jun 21  Jun 22  Jun 23  Jun 24  Jun 25
       Low estimate            1 408.9   1 557.2    0.0  MORE RATIOS AND STATS (Finals only)
       Standard deviation        56.6    64.4    0.0          Jun 25  Jun 24  Jun 23  Jun 22  Jun 21
                                                               Final  Final  Final  Final  Final
       Profile Media Consensus   1 512.8   1 683.2    0.0  Sales/Share(c)   9 272.52  9 089.88  8 556.45  7 419.33  11 646.86
       Pct change prev year     7.9%    11.3%  -  100.0%  Pct chng    2.0    6.2    15.3  -  36.3    20.2
       Prospective P/E           11.7    10.5  â ˆ   Tr 5 yr avg   9 197.01  9 280.05  9 476.43  8 863.11   8 376.68
       Fwd price: hi REM P/E, hi est   25 073   27 552    0  Price/Sales ps    1.70    1.49    1.71    1.71    0.96
       Fwd price: hi REM P/E, lo est   22 386   24 742    0  Price/NAV    0.75    0.67    0.71    0.73    0.74
       Fwd price: lo REM P/E, hi est   17 169   18 866    0  Price/CashFlow    17.97    24.54    58.16    10.08    11.86
       Fwd price: lo REM P/E, lo est   15 329   16 943    0
                                                 Tr 3 yr avg TotRet    9.31    8.45    15.62    0.12  -  5.99
       DIVIDEND FORECASTS    Jun 26 F  Jun 27 F  Jun 28 F  Tr 5 yr avg TotRet    11.53    2.05    2.13  -  1.43  -  6.94
                               DPS   DPS    DPS  Volatility       6.3    6.2    6.1    7.0    6.8
       Number of contributors    1     1      0
       High estimate            162.9    172.6    0.0
                                                        Risk / Return Profile  PEG Inverse 3.33
       Low estimate             162.9    172.6    0.0  140
                                                                        50
       Standard deviation        0.0    0.0    0.0
       Profile Media Consensus    162.9    172.6    0.0  3Yr Compound Return  20
       Pct change prev year  -  69.9%    6.0%  -  100.0%                5 Yr Average HEPS Growth
       Prospective DY            0.9    1.0    0.0
                                                   -100                  0
                                                    0      140   280     0            50
                       Historical PE Range                Volatility           P/E
                                            600
                                                 HISTORICAL SHARE PRICE PERFORMANCE DATA
                                            400
                                                 Annualised returns with divs reinvested to 3 Dec 2025
                                                                    Grwth in  Annualised
                                            200
        Avg High                                           p.a. Return  R1000  Inflation  Volatility
        Average 67.49
        Avg Low
                                            0    1 Yr         20.55%   1 206  3.59%    3.5
        2021    2022     2023     2024     2025
                                                 2 Yr         13.96%   1 299  3.26%    6.1
           REM Hi PE, Hi Est  Hi PE, Lo Est  Lo PE, Hi Est  Lo PE, Lo Est  P/E
        500                                30000  3 Yr        11.88%   1 400  4.01%    6.0
                                           25000  5 Yr        15.89%   2 090  4.97%    6.0
        400
                                           20000  7 Yr        4.98%    1 405  4.52%   6.9%
        300
                                           15000  10 Yrs      2.18%    1 240  4.80%    6.4
        200
                                           10000
                                                     TRI  REM
        100                                5000   120
                                                  100
         0                                 0
        Jan 2021  Jan 2022  Jan 2023  Jan 2024  Jan 2025  Jan 2026  Jan 2027  Jan 2028  80
                                                   60
            Forecast HEPS Growth  Forecast DPS Growth
        1800                 550                   40
        1600      11.3%      500
        1400   7.9%          450                   20
                             400
        1200                                       0
                             350
        1000                 300
         800                 250                  -20 Jan 2021  Jan 2022  Jan 2023  Jan 2024  Jan 2025
                             200
         600
                             150
         400                       -69.9%  6.0%
                             100
         200
                              50
         0                    0
           2025  2026  2027  2028  2025  2026  2027  2028
           Actual               Actual
                                              169
   166   167   168   169   170   171   172   173   174   175   176